Construction employment, spending hit highest levels since 2009; Beige Book is upbeatEditor’s note: Construction Citizen is proud to partner with AGC America to bring you AGC Chief Economist Ken Simonson's Data DIGest. Check back each week to get Ken's expert analysis of what's happening in our industry.Nonfarm payroll employment increased by 175,000, seasonally adjusted, in February and 2,158,000 (1.6%) over 12 months, the Bureau of Labor Statistics (BLS) reported on Friday. Construction employment rose by 15,000 for the month and 152,000 (2.6%) over the year to 5,941,000, the highest total since June 2009. Despite the gain in jobs, aggregate weekly hours fell year-over-year for the first time since April 2011 (-0.5%), indicating severe weather idled many workers. Residential construction employment (residential building and specialty trade contractors) climbed by 1,700 for the month and 101,200 (4.8%) for the year. Nonresidential employment (building, specialty trades, and heavy and civil engineering construction) rose by 12,700 from January and 50,600 (1.4%) year-over-year. All five residential and nonresidential segments added workers for the year. The unemployment rate for jobseekers who last worked in construction fell to the lowest February level in six years ...
Starts tumble in January, MHC and Reed say; IIR sees double-digit industrial project riseEditor’s note: Construction Citizen is proud to partner with AGC America to bring you AGC Chief Economist Ken Simonson's Data DIGest. Check back each week to get Ken's expert analysis of what's happening in our industry.The value of new construction starts (including residential) tumbled 13%, seasonally adjusted, in January 2014 from December 2013 and 5%, not seasonally adjusted, from January 2013, McGraw Hill Construction (MHC) reported on February 21, based on data it collected. There were “moderate declines reported for nonresidential building [-6% for the month and year-over-year] and housing [-2% for the month, +8% year-over-year], as well as a more substantial loss of momentum [–32% for the month, -19% year-over-year] for nonbuilding construction (public works and electric utilities) after a particularly robust December…
March 03, 2014
Construction PPIs jump in January; housing starts and permits slide; ABI turns positiveEditor’s note: Construction Citizen is proud to partner with AGC America to bring you AGC Chief Economist Ken Simonson's Data DIGest. Check back each week to get Ken's expert analysis of what's happening in our industry.The producer price index (PPI) for final demand increased 0.4%, not seasonally adjusted (0.2%, seasonally adjusted), in January and 1.2% over 12 months, the Bureau of Labor Statistics (BLS) reported last Wednesday. The PPI for final demand covers about twice as much production as the prior headline PPI for finished goods, because the new index includes final demand construction (2% of total final demand) and final demand services (64%), in addition to final demand goods (34%). AGC posted an explanation and tables focusing on construction prices and costs. Construction is limited to five types of nonresidential buildings that BLS says make up 34% of total construction.
February 24, 2014
Wintry weather unlikely to chill materials price increases; LNG, hotel markets advanceEditor’s note: Construction Citizen is proud to partner with AGC America to bring you AGC Chief Economist Ken Simonson's Data DIGest. Check back each week to get Ken's expert analysis of what's happening in our industry.The widespread extreme weather this winter is likely to distort construction spending and employment data for several months but not change longer-term trends. “As one industry contact noted, just because it snows on a Saturday doesn’t mean that by Tuesday when the weather clears you don’t want to buy carpet,” Thompson Research Group (TRG) wrote last Monday in its monthly building products survey. “A contact with whom we met at the International Builder’s Show in Las Vegas last week noted that there has been meaningful improvement in terms of working in adverse weather conditions over the past 10 years (i.e., able to pour concrete in colder weather, etc.).
February 17, 2014
Editor’s note: AGC Houston held their 2014 Annual Chapter Meeting last month where Ken Simonson offered attendees his update about the improving economy and what that means for construction companies in 2014. After talking about Texas’s positive construction employment growth during part two of his presentation, he concludes with more construction employment data and summaries of producer price indexes for several key materials.In spite of every metropolis in Texas showing positive growth or at least level employment over the past year, Texas still isn't even within 10% of its previous peak construction employment, so I think you have quite a ways to go. Does that mean that you'll be able to keep on hiring?
February 12, 2014
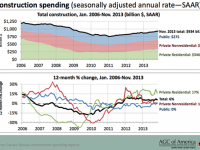
Construction employment jumps in January; spending inches up in DecemberEditor’s note: Construction Citizen is proud to partner with AGC America to bring you AGC Chief Economist Ken Simonson's Data DIGest. Check back each week to get Ken's expert analysis of what's happening in our industry.Nonfarm payroll employment increased by 113,000, seasonally adjusted, in December and 2,238,000 (1.7%) over 12 months, the Bureau of Labor Statistics (BLS) reported Friday. (Today’s data included routine once-a-year revisions to monthly data back to January 2009.) Construction employment rose by 48,000 (the largest one-month gain since April 2007) to 5,922,000. Over the past 12 months the industry added 179,000 employees (3.1%). Residential construction employment (residential building and specialty trade contractors) climbed by 16,800 for the month and 121,400 (5.8%) for the year. Nonresidential employment (building, specialty trades, and heavy and civil engineering construction) rose by 31,300 from December and 57,100 (1.6%) year-over-year.
February 10, 2014
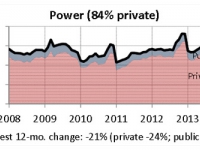
Editor’s note: AGC Houston held their 2014 Annual Chapter Meeting in January where Ken Simonson offered attendees his update about the improving economy and what that means for construction companies in 2014. In part two of his presentation, he talked about construction spending in various sectors and about construction employment – comparing employment in Texas to that in the rest of the United States.The biggest category in industrial construction spending is the one the census calls power. That includes not just coal, gas, and nuclear-fired power plants, but also those wind projects that have been popping up all over west Texas, solar power, and the transmission lines that you need to carry the power from where it's being generated to where it's being used. It also includes everything that is happening in the oil and gas fields and the pipeline work. It's surprising to see this category down 21%, but that's really kind of a policy-driven fluke.
February 05, 2014
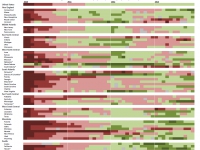
Two-thirds of states post job gains; labor costs rise modestly; steel prices go up for nowEditor’s note: Construction Citizen is proud to partner with AGC America to bring you AGC Chief Economist Ken Simonson's Data DIGest. Check back each week to get Ken's expert analysis of what's happening in our industry.Seasonally adjusted construction employment increased in 34 states between December 2012 and December 2013, decreased in 15 states and the District of Columbia, and remained level in Nebraska, an AGC analysis of Bureau of Labor Statistics (BLS) data released last Tuesday showed. Mississippi led all states with an 18% rise (8,500 jobs), followed by Connecticut (12%, 5,800 jobs), Florida (8.4%, 28,800 jobs) and Wyoming (8.3%, 1,800 jobs). California added the most jobs over the year (28,900, 4.8%), followed by Florida, Texas (13,500, 2.3%), Georgia (9,900, 7.1%) and Mississippi.
February 03, 2014
Editor’s note: AGC Houston held their 2014 Annual Chapter Meeting last week where attendees heard about the chapter’s 2013 successes and accomplishments and also received economic and construction industry updates from featured speakers. Ken Simonson, Chief Economist for the Associated General Contractors of America, offered the following update about the improving economy and what that means for construction companies in 2014.Last week, AGC of America put out our annual survey that over 800 companies participated in, and for the first time in the five years that we've done this survey, there was much more optimism about the current year than there was pessimism. We asked first to say when they thought the market would turn positive, and a plurality, 37%, said 2014. Over two-thirds of the firms said it would be this year or next year, and previously a majority had always said that things weren't going to turn up for at least two years. Now here in Houston, the good times have already been rolling, and the breakout on Texas contractors definitely shows more optimism about the current year and about most business segments than the national survey.
January 29, 2014
AGC members, MHC, Reed economists foresee upturn in 2014; union share of jobs risesEditor’s note: Construction Citizen is proud to partner with AGC America to bring you AGC Chief Economist Ken Simonson's Data DIGest. Check back each week to get Ken's expert analysis of what's happening in our industry.Contractors are more upbeat about the near-term outlook for construction – especially private construction – than they have been since the recession ended in 2009, according to an annual survey AGC released last Tuesday. More than 800 members from every state and the District of Columbia answered the online questionnaire in December or early January. In contrast to prior years, when most respondents thought the construction market would not begin to grow for two years or more, a plurality of this year’s respondents – 37% – picked 2014 as the year the market would grow.
January 27, 2014


