
39 states, DC add jobs in last 12 months; multifamily starts, permits outrun single-family Editor’s note: Construction Citizen is proud to partner with AGC America to bring you AGC Chief Economist Ken Simonson's Data DIGest. Check back each week to get Ken's expert analysis of what's happening in our industry.Seasonally adjusted construction employment increased in 39 states and the District of Columbia from April 2013 to April 2014, decreased in 10 states, and remained level in Wyoming, an AGC analysis of Bureau of Labor Statistics (BLS) data released Friday showed. The largest percentage gains were in Florida (12%, 43,300 jobs), North Dakota (11%, 3,400) and Nevada (9.4%, 5,400). Florida also led in number of jobs added, followed by California (39,000, 6.2%) and Texas (23,900, 3.9%). New Jersey lost the most construction jobs (-9,300, -6.8%), followed by New Mexico (-2,000, -4.8%), West Virginia (-1,300, -3.7%) and Alabama (-2.2%, -1,800).


Leading indicators from MHC, AIA send mixed signals; office-to-apartment trend spreadsEditor’s note: Construction Citizen is proud to partner with AGC America to bring you AGC Chief Economist Ken Simonson's Data DIGest. Check back each week to get Ken's expert analysis of what's happening in our industry.The Dodge Momentum Index, “a monthly measure of the first (or initial) report for nonresidential building projects in planning,” advanced 8.4% in April, McGraw Hill Construction (MHC) reported last Thursday. The index has “been shown to lead construction spending for nonresidential buildings by a full year. The Momentum Index had retreated in February and March, following the steady gains that were reported during most of 2013. With the April increase, the Momentum Index resumed its upward track, and is up 17.8% compared to the same month a year ago. A harsh winter helped slow overall economic growth in the first months of 2014, but prospects for commercial development are again showing improvement, as reflected by the growing volume of projects at the planning stage and strengthening market fundamentals such as occupancy rates and rents. The April Momentum Index was bolstered by an upturn for both of its segments. Commercial was the stronger of the two components, climbing 12.1% from March….The institutional segment of the Momentum Index, meanwhile, rose 3.9% in April, marking its first monthly increase since January.”

May 12, 2014


Construction employment is up nationally in April, in most metros in March; outlays riseEditor’s note: Construction Citizen is proud to partner with AGC America to bring you AGC Chief Economist Ken Simonson's Data DIGest. Check back each week to get Ken's expert analysis of what's happening in our industry.Nonfarm payroll employment increased by 288,000, seasonally adjusted, in April and 2,367,000 (1.7%) over 12 months, the Bureau of Labor Statistics (BLS) reported Friday. Construction employment rose by 32,000 for the month and 189,000 (3.3%) over the year to 6,000,000, the highest total since June 2009. Residential construction employment (residential building and specialty trade contractors) climbed by 13,100 for the month and 107,900 (5.0%) for the year. Nonresidential employment (building, specialty trades, and heavy and civil engineering construction) rose by 18,600 from March and 81,300 (2.2%) year-over-year. All five residential and nonresidential segments added workers for the month and year. Aggregate hours worked in construction increased 3.8% over 12 months.
May 05, 2014


Nonresidential starts rise, MHC says; ABI turns negative; industry GDP fell in late 2013Editor’s note: Construction Citizen is proud to partner with AGC America to bring you AGC Chief Economist Ken Simonson's Data DIGest. Check back each week to get Ken's expert analysis of what's happening in our industry.The value of new construction starts in March increased 7% at a seasonally adjusted annual rate, McGraw Hill Construction (MHC) reported last Monday, based on data it collected. “Nonresidential building picked up the pace [+24%] after its lackluster performance at the outset of this year, while nonbuilding construction managed a moderate gain [6%]. Meanwhile, residential building settled back [-2%] as single-family housing remained sluggish. During the first three months of 2014, total construction starts on an unadjusted basis were…down 2% from the same period a year ago.”
April 28, 2014


State employment data, Beige Book find widespread increases; starts dip, Reed saysEditor’s note: Construction Citizen is proud to partner with AGC America to bring you AGC Chief Economist Ken Simonson's Data DIGest. Check back each week to get Ken's expert analysis of what's happening in our industry.Seasonally adjusted construction employment increased in 38 states between March 2013 and March 2014, decreased in 11 states and the District of Columbia, and remained level in Alaska, an AGC analysis of Bureau of Labor Statistics (BLS) data released Friday showed. The largest percentage gains were in Florida (11%, 41,000); Oregon (11%, 7,800); and Minnesota (10%, 10,200). Florida also led in number of jobs added, followed by California (37,100, 5.9%) and Texas (17,100, 2.8%). New Jersey lost the most construction jobs (-4,600, -3.4%), followed by Kentucky (-1,900, -2.8%) and West Virginia (-1,700, -4.9%). The steepest percentage losses over the year occurred in West Virginia, New Jersey and D.C. (-2.9%, -400).
April 21, 2014


PPIs remain mild; most metros add jobs; ABI ably predicts building activity, AIA findsEditor’s note: Construction Citizen is proud to partner with AGC America to bring you AGC Chief Economist Ken Simonson's Data DIGest. Check back each week to get Ken's expert analysis of what's happening in our industry.Sign up for a complimentary webinar on construction outlook on April 17 with me; AIA Chief Economist Kermit Baker; and Reed Construction Data’s Chief U.S. Economist, Bernard Markstein.The producer price index (PPI) for final demand increased 0.7%, not seasonally adjusted (0.5%, seasonally adjusted), in March and 1.4% over 12 months, the Bureau of Labor Statistics (BLS) reported Friday.
April 14, 2014
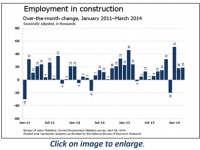
Construction posts gains in March jobs, February spending; costs accelerate, RLB saysEditor’s note: Construction Citizen is proud to partner with AGC America to bring you AGC Chief Economist Ken Simonson's Data DIGest. Check back each week to get Ken's expert analysis of what's happening in our industry.Nonfarm payroll employment increased by 192,000, seasonally adjusted, in March and 2,246,000 (1.7%) over 12 months, the Bureau of Labor Statistics (BLS) reported Friday. Construction employment rose by 19,000 for the month and 151,000 (2.6%) over the year to 5,964,000, the highest total since June 2009. Residential construction employment (residential building and specialty trade contractors) climbed by 9,100 for the month and 103,000 (4.8%) for the year. Nonresidential employment (building, specialty trades, and heavy and civil engineering construction) rose by 9,900 from February and 48,800 (1.3%) year-over-year.
April 07, 2014


37 states added jobs in year ending in February; population growth swings to big metrosEditor’s note: Construction Citizen is proud to partner with AGC America to bring you AGC Chief Economist Ken Simonson's Data DIGest. Check back each week to get Ken's expert analysis of what's happening in our industry.Sign up here for complimentary webinar on construction outlook on April 17 with me; AIA Chief Economist Kermit Baker; and Reed Construction Data’s Chief U.S. Economist, Bernard Markstein.Seasonally adjusted construction employment increased in 37 states between February 2013 and February 2014, decreased in 10 states and the District of Columbia, and remained level in Hawaii, Maine, and South Dakota, an AGC analysis of Bureau of Labor Statistics (BLS) data released Friday showed. The largest percentage gains were in Florida (11%, 39,200); Nevada (10.4%, 5,800 jobs); Oregon (9.8%, 7,000); Minnesota (8.1%, 7,900) and Connecticut (7.2%, 3,800).
April 01, 2014


Most states, metros added jobs in latest year; MHC, Reed, ABI differ on activity levelsEditor’s note: Construction Citizen is proud to partner with AGC America to bring you AGC Chief Economist Ken Simonson's Data DIGest. Check back each week to get Ken's expert analysis of what's happening in our industry.Seasonally adjusted construction employment increased in 38 states between January 2013 and January 2014, decreased in nine states and the District of Columbia, and remained level in Maine, New Mexico and Rhode Island, an AGC analysis of Bureau of Labor Statistics (BLS) data released last week showed. The largest percentage gains were in Kansas (10.7%, 5,900 jobs); Oregon (9.4%, 6,600); Florida (9.2%, 32,700); Minnesota (9.2%, 8,900) and Alaska (9.1%, 1,500). Florida added the most jobs, followed by California (27,300, 4.4%) and Texas (26,000, 4.3%).
March 24, 2014

PPIs remain mild; commercial construction looks solid, Wells Fargo saysEditor’s note: Construction Citizen is proud to partner with AGC America to bring you AGC Chief Economist Ken Simonson's Data DIGest. Check back each week to get Ken's expert analysis of what's happening in our industry.The producer price index (PPI) for final demand increased 0.2%, not seasonally adjusted (but fell -0.1%, seasonally adjusted), in February and 0.9% over 12 months, the Bureau of Labor Statistics (BLS) reported Friday. The PPI for final demand covers not only the prior headline PPI for finished goods (about 34% of total final demand), but also final demand services (64% of the total) and final demand construction (2% of the total). AGC posted an explanation and tables focusing on construction prices and costs. Construction is limited to five types of nonresidential buildings that BLS says make up 34% of total construction.
March 17, 2014
