AGC's Data DIGest: October 21-24, 2014

Contractors report trouble finding workers, expect worse ahead as employment picks up Editor’s note: Construction Citizen is proud to partner with AGC America to bring you AGC Chief Economist Ken Simonson's Data DIGest. Check back each week to get Ken's expert analysis of what's happening in our industry.
Contractors report increasing difficulty finding qualified workers. AGC reported last Wednesday that 83% of the 1,086 respondents to a survey it conducted in late August and September said their firms were having a hard time filling craft worker positions and 61% said the same about key professional positions. (In a survey AGC released in January, 53% reported difficulty filling craft positions and 45% reported difficulty filling professional positions.) Of 12 crafts included in the survey, the most-cited position was carpenters, with 66% of firms that employ carpenters saying they are hard to find. Other hard-to-fill crafts included roofers (listed by 64% of firms that employ them); equipment operators (59%); plumbers (54%); electricians (52%); iron workers, laborers and pipefitters/welders (49% each); and cement masons (48%). [node:read-more:link]
 Editor’s note: Construction Citizen is proud to partner with
  Editor’s note: Construction Citizen is proud to partner with
  Editor’s note: Construction Citizen is proud to partner with
 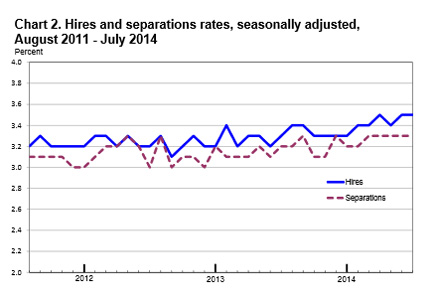 Editor’s note: Construction Citizen is proud to partner with
  Editor’s note: Construction Citizen is proud to partner with
  Editor’s note: Construction Citizen is proud to partner with
  Editor’s note: Construction Citizen is proud to partner with
  Editor’s note: Construction Citizen is proud to partner with
  Editor’s note: Construction Citizen is proud to partner with