Construction has mixed impact on first-quarter GDP; AIA, NABE surveys point to upturn
 Editor’s note: Construction Citizen is proud to partner with AGC America to bring you AGC Chief Economist Ken Simonson's Data DIGest. Check back each week to get Ken's expert analysis of what's happening in our industry.
Real (net of inflation) gross domestic product (GDP) increased 2.5% at a seasonally adjusted annual rate in the first quarter of 2013, after growing 0.4% in the prior quarter, the Bureau of Economic Analysis (BEA) reported on Wednesday. Real private investment in nonresidential structures (including wells and mines) slipped 0.3%, after jumping 17% in the fourth quarter. Real residential investment climbed 13%, following a 18% gain. Real government investment in structures shrank for the 10th consecutive quarter, at a 5.6% rate, following a 2.6% decline. The price index for private nonresidential structures posted a 1.5% increase at a seasonally adjusted annual rate, similar to the previous quarter’s 1.4% rise. The price index for residential investment accelerated to 5.2% from 3.0% as strong demand from single- and multifamily builders pushed up prices for homebuilding materials. The price index for government investment rose at a 2.3% rate, up from 1.7%.
“Business conditions at architecture firms improved for the eighth consecutive month in March,” the American Institute of Architects (AIA) reported today in its monthly Work-on-the-Boards survey. The survey asks more than 700 architecture firms if their billings increased or decreased from a month earlier. The percentage difference is reported on a scale from 0 to 100 as the Architecture Billings Index (ABI), where 50 indicates an even split. “While the pace of firm billings growth slowed slightly [to 51.9 in March from 54.9 in February and 54.2 in January], inquiries into new projects remain very strong, and more firms reported an increase in the value of new design contracts than in February. In addition, firm backlogs have risen to an average of five months.” Scores based on three-month moving averages by practice specialization were all favorable: residential, 56.9; commercial/industrial, 53.5; institutional, 50.6; and mixed, 53.3. An analysis conducted by the AIA before the 2006-2011 downturn in construction showed the ABI led construction spending by 9-12 months.
A quarterly survey of 58 corporate economists that the National Association for Business Economics (NABE) released on Monday found “business activity advanced at its strongest pace in a year during the first quarter of 2013. Expectations for capital spending on structures [among 38 respondents to this question] also strengthened compared to three months earlier…., with more panelists expecting their firms to increase spending (26% vs. 19% in January) and fewer expecting their firms to cut spending (8% vs. 12% in January).”
"Real value added for construction—a measure of an industry’s contribution to GDP—turned up in 2012, after eight consecutive years of contraction, reflecting strong growth in private residential construction,” BEA reported on Thursday. Construction was one of 19 industries that contributed to the 2.2% increase in real GDP in 2012 (out of 22 industries in all). Value added in construction constituted 3.6% of GDP, up slightly from a record low of 3.5% in 2011 (in a series that dates back to 1947). The high-water mark was 4.9% of GDP in 2005 and 2006. The “chain-type price index” for value added by industry group rose 1.8% overall and 2.3% in construction in 2012, following increases of 2.1% overall and 1.5% in construction in 2011. “An industry’s value added price measures the changes in its unit costs of capital and labor inputs, as well as its profits per unit of output, and reflects the productivity of capital and labor used by the industry.”
Housing starts in March jumped 7.0% at a seasonally adjusted annual rate from the February level and 47% from a year ago, the Census Bureau reported on April 16. Multifamily starts (five units or more) soared 27% for the month and 82% year-over-year, while single-family starts slid 4.8% for the month but climbed 29% from the March 2012 level. Building permits, an indicator of near-term future starts, fell 3.9% for the month but rose 17% year-over-year. Permits for 5+ unit multifamily starts slumped 8.1% in March and inched up 0.7% from a year ago. Single-family permits dipped 0.5% in March but leaped 28% over 12 months.
CPWR, the Center for Construction Research and Training, on Thursday released the fifth edition of The Construction Chart Book. The “142-page book of data presents the most complete statistics available on all facets of the U.S. construction industry: economic, demographic, employment/income, education/training, and safety and health issues, plus new topics, such as Displaced Workers, Employment Projections, Green Construction, and OSHA Citations/Violations/Penalties.”
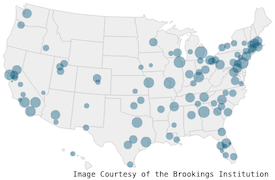
“Steep employment losses following the Great Recession stalled the steady decentralization of jobs that characterized the early to mid-2000s,” according to a Brookings Institution analysis released on April 19. “… the share of metropolitan jobs within three miles of downtown stabilized from 2007 to 2010. However, by 2010 nearly twice the share of jobs was located at least 10 miles away from downtown (43%) as within three miles of downtown (23%). Job losses in industries hit hardest by the downturn, including construction and manufacturing, helped check employment decentralization in the late 2000s. Together, construction, manufacturing, and retail—each among the most decentralized of major industries—accounted for almost 60% of all job losses between 2007 and 2010, with half of those losses occurring at least 10 miles from downtown.”
The Data DIGest is a weekly summary of economic news; items most relevant to construction are in italics. All rights reserved. Sign up at www.agc.org/datadigest.


Add new comment