
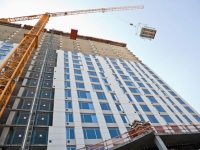
Data-tracking consultancy Lodging Econometrics reported on May 10 that the first-quarter 2017 hotel construction "pipeline currently stands at 5,032 projects..., up 13% by projects year-over-year....There are 1,511 projects...under construction, up by 155 projects [year-over-year] or 11%."


Seasonally adjusted construction employment rose in 39 states from April 2016 to April 2017, held steady in North Carolina and West Virginia, and fell in nine states and the District of Columbia, an AGC analysis of BLS data released on Friday showed.

May 24, 2017


Editor’s note: Construction Citizen is proud to partner with AGC America to bring you AGC Chief Economist Ken Simonson's Data DIGest. Check back each week to get Ken's expert analysis of what's happening in our industry. The producer price index (PPI) for final demand in April, not seasonally adjusted, increased 0.4% from March and 2.5% year-over-year (y/y) from April 2016, the Bureau of Labor Statistics (BLS) reported on Thursday. AGC posted tables and an explanation focusing on construction prices and costs. Final demand includes goods, services and five types of nonresidential buildings that BLS says make up 34% of total construction.
May 15, 2017


The Construction Labor Research Council issued Union Construction Labor Cost Trends and Outlook 2017, covering construction union local pay agreements ratified in 2016. First-year increases are projected to rise from 2.8% in both 2015 and 2016 to 2.9% in 2017 and 3.1% in 2018. Among 17 crafts, 2017 first-year increases range from 1.6% for boilermakers to 4.1% for painters. Among eight regions, increases range from 2.3% in New England to 3.4% in the South Central region.
May 01, 2017


Seasonally adjusted construction employment rose in 39 states from March 2016 to March 2017, held steady in West Virginia, and fell in 10 states and the District of Columbia, an AGC analysis of BLS data released today showed. Oregon again had the largest percentage gain (9.2%, 8,200 jobs), followed by Nevada (8.3%, 6,200), Rhode Island (8.2%, 1,500) and Florida (7.9%, 36,500).
April 24, 2017
The producer price index (PPI) for final demand in March, not seasonally adjusted, increased 0.2% from February and 2.3% year-over-year (y/y) from March 2016, the Bureau of Labor Statistics (BLS) reported on Thursday. AGC posted tables and an explanation focusing on construction prices and costs. Final demand includes goods, services and five types of nonresidential buildings that BLS says make up 34% of total construction.
April 14, 2017


Nonfarm payroll employment in March increased by 98,000, seasonally adjusted, from February and by 2,185,000 (1.5%) year-over-year (y/y), the Bureau of Labor Statistics (BLS) reported today. The unemployment rate declined to 4.5% from 4.7% in February. Construction employment increased by 6,000, following a 59,000-job jump in February, the largest one-month gain in 11 years.
April 11, 2017


Seasonally adjusted construction employment rose in 43 states from February 2016 to February 2017 and fell in seven states and the District of Columbia, an AGC analysis of Bureau of Labor Statistics (BLS) data released on Friday showed. Rhode Island led in percentage gain (12%, 2,200 jobs), followed by Idaho (10%, 4,200), Oregon (10%, 8,900) and Louisiana (9.6%, 13,500).
April 04, 2017

Dodge, ConstructConnect, ABI, Census find divergent starts, design and permit trendsThe value of construction starts rose 2% from January to February at a seasonally adjusted annual rate, Dodge Data & Analytics reported on Tuesday. "This was the second straight monthly increase, following a 15% hike in January [revised up from an initial estimate of +12%], as construction starts regained the upward track following four consecutive monthly declines to close out 2016. Much of February's advance came from a strong performance by the public works sector, led by the start of a $1.4 billion natural gas pipeline in Ohio, West Virginia, and Pennsylvania, plus an improved level of highway and bridge construction. The electric utility/gas plant category also strengthened with the start of two large power plants and a major transmission line project. At the same time, nonresidential building made a partial retreat [-9%] after its strong January performance, yet still remained slightly above its average monthly pace during 2016.
March 23, 2017


Construction input costs again outpace building PPIs; hires rise; 39 states add jobsEditor’s note: Construction Citizen is proud to partner with AGC America to bring you AGC Chief Economist Ken Simonson's Data DIGest. Check back each week to get Ken's expert analysis of what's happening in our industry.The producer price index (PPI) for final demand in February, not seasonally adjusted, increased 0.4% from January and 2.2% year-over-year (y/y) from February 2017, the Bureau of Labor Statistics (BLS) reported on Tuesday. AGC posted tables and an explanation focusing on construction prices and costs. Final demand includes goods, services and five types of nonresidential buildings that BLS says make up 34% of total construction. The PPI for final demand construction, not seasonally adjusted, dipped 0.1% for the month but increased 1.2% y/y.
March 21, 2017
