AGC's Data DIGest: April 19-22, 2016

Building products volumes rise, results vary for prices; nonresidential starts increase
 Editor’s note: Construction Citizen is proud to partner with AGC America to bring you AGC Chief Economist Ken Simonson's Data DIGest. Check back each week to get Ken's expert analysis of what's happening in our industry.
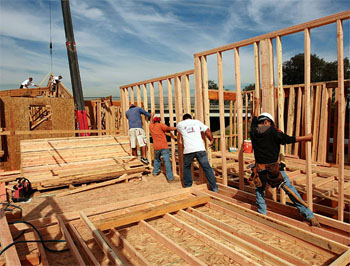
Securities research firm Thompson Research Group on April 12 released its quarterly building products survey of select manufacturers and distributors with more than 300 locations nationwide "on the state of the residential and nonres[identical] construction end markets....A common theme from all contacts was...a tight labor market along the value chain (truck driver shortages to drywall installers)....Overall nonres volumes are projected to be up mid-to-high single digits, depending upon the industry contact. Earlier construction value chain feedback is for 6-8% [increase in] volumes...Other contacts with a wider range of early and later cycle nonres products cite a...4-6% range. Healthcare end market remains strong, and office growth is also driving demand. Not surprisingly, industry contacts confirm that the multifamily end market growth rates are likely to slow in 2016 [to] (small single digits growth). [node:read-more:link]
 Editor’s note: Construction Citizen is proud to partner with
  Editor’s note: Construction Citizen is proud to partner with
  Editor’s note: Construction Citizen is proud to partner with
  Editor’s note: Construction Citizen is proud to partner with

 Editor’s note: Construction Citizen is proud to partner with
  Editor’s note: Construction Citizen is proud to partner with
  Click on image to view more information.
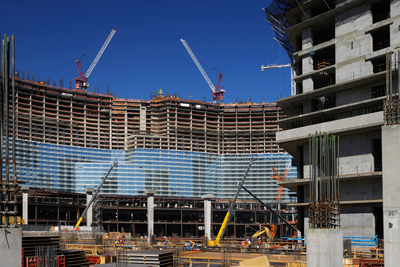 Editor’s note: Construction Citizen is proud to partner with