
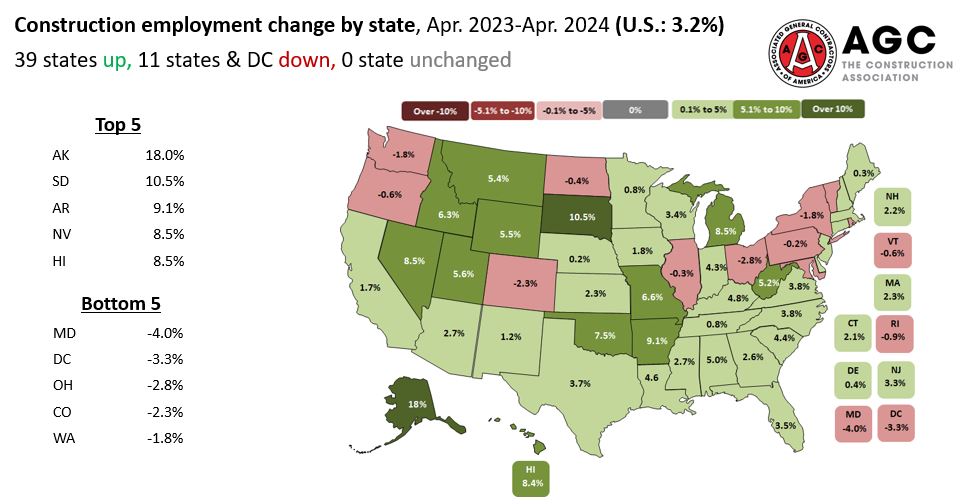
 Seasonally adjusted construction employment rose year-over-year (y/y) from April 2023 to April 2024 in 39 states and declined in 11 states and the District of Columbia, according to AGC’s analysis of data the Bureau of Labor Statistics (BLS) posted today. Texas added the most construction employees (30,500 or 3.7%), followed by Florida (22,100, 3.5%) and Michigan (16,100, 8.5%). The steepest percentage increases again occurred in Alaska (18%, 3,000 jobs), South Dakota (10%, 2,900), and Arkansas (9.1%, 5,700). New York again lost the most jobs (-7,100, -1.8%), followed by Ohio (-6,700, -2.8%) and Maryland (-6,400, -4.0%). Maryland had the largest percentage loss, followed by D.C. (-3.3%, -500 jobs) and Ohio. For the month, construction employment rose in 29 states, declined in 18 states and D.C., and was unchanged in Mississippi, Rhode Island, and South Carolina. Michigan added the largest number and percentage of jobs over the month (4,200 jobs, 2.1%). Other states with large monthly increases job include Washington (3,100, 1.4%) and Missouri (2,300, 1.5%). Other states with large percentage gains include Hawaii (1.7%, 700 jobs), Missouri, and Washington. Ohio lost the most jobs from March to April (-7,600, -3.2%), followed by California (-6,000, -0.6%) and Iowa (-3,100, -3.2%). Iowa lost the highest percentage, followed by Ohio and West Virgina (-1.6%, -600 jobs). (For D.C., Delaware, and Hawaii, BLS posts combined totals for mining, logging, and construction; AGC treats the changes as all from construction.)
Bid prices and input prices for construction showed mixed monthly and y/y patterns in April, according to data the Bureau of Labor Statistics (BLS) posted on Tuesday. The producer price index (PPI) for material and service inputs to new nonresidential construction rose 0.4%, not seasonally adjusted, for the third month in a row and 1.5% y/y. The PPI for new nonresidential building construction—a measure of prices that contractors say they would bid to erect a fixed set of buildings—inched up 0.1% in April but slipped 1.0% y/y. AGC posted tables of construction PPIs.
Higher tariffs and tighter Buy America rules may push up costs later this year. “The tariff rate on certain steel and aluminum products [from China] will increase from 0–7.5% to 25% in 2024,” the White House announced on Monday. “The tariff rate on solar cells (whether or not assembled into modules) will increase from 25% to 50% in 2024.” A majority of the 192 highway-related firms responding to a survey by AGC and the American Road and Transportation Builders Association “believe that [the Federal Highway Administration’s proposed rollback of a longstanding] manufactured products waiver would require significant additional time and cost to document and certify the components within manufactured products,” the associations wrote in a letter to the agency on Monday. Readers are invited to report supply-chain issues and price announcements to ken.simonson@agc.org.
Housing starts (units) in April increased 5.7% from March but slipped 0.6% y/y at a seasonally adjusted annual rate, the Census Bureau reported on Thursday. Single-family starts dipped 0.6% for the month but rose 26% y/y. Multifamily (five or more units) starts jumped 31% for the month but fell 32% y/y. Residential permits declined 3.0% for the month but rose 2.0% y/y. Single-family permits decreased 0.8% from March but climbed 11% y/y. Multifamily permits slumped 9.1% and 23%, respectively. Multifamily units under construction declined for the sixth month in a row, by 1.6%.
The total number of multifamily permits declined 23% year-to-date in the first three months of 2024 compared to the same period in 2023, the National Association of Home Builders (NAHB) reported on Tuesday, based on Census Bureau data. Permits are a leading indicator for multifamily construction but not all permits turn into starts. Permits increased in 15 states and decreased in 35 states and the District of Columbia. Among the top three states for multifamily permits, Texas experienced a decline of 37%, New York saw an increase of 121%, and Florida declined by 45%.
All 15 of the largest numeric increases and 13 of the 15 fastest-growing cities (with populations of 20,000 or more) between July 1, 2022 and July 1, 2023 were in the South, Census reported on Thursday. The largest numeric gains were in San Antonio (21,970) and Fort Worth (21,365). Eight of the 11 fastest-growing cities were in Texas, including the top four, led by Celina (27%) and Fulshear (26%). “Cities with populations of 50,000 or more grew by an average of 0.2% in the Northeast and 0.1% in the Midwest after declining an average of 0.3% and 0.2%, respectively, in 2022. Those in the West went up by an average of 0.2% from 2022 to 2023. Cities in the South grew the fastest – by an average 1.0%.” Every state had an increase in housing units, ranging from Utah (2.5%) and Idaho (2.3%) to Rhode Island (0.2%) and Alaska (0.1%).
Download the Data Digest click here.
