
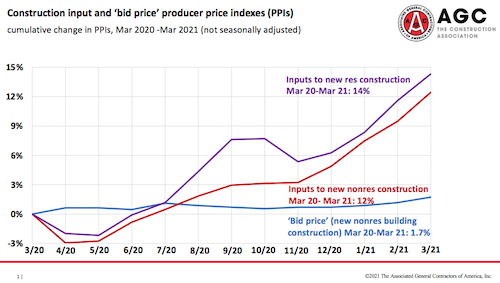
 The gap between input costs for construction and contractors’ bid prices widened further in March. The producer price index (PPI) for nonresidential building construction—a measure of the price that contractors say they would charge to build a fixed set of buildings—increased 0.5% from February and 1.7% year-over-year (y/y) since March 2020, while the PPI for material and service inputs to new nonresidential construction jumped 2.7% and 12.4%, respectively, the Bureau of Labor Statistics (BLS) reported today. An index that measures the price of goods inputs to all construction soared 3.5% for the month and 12.9% y/y, the largest increases in the 35-year history of the series. AGC posted tables and charts showing PPIs relevant to construction. PPIs that contributed to the input increases include diesel fuel, which leaped 15% in March and 79% y/y; lumber and plywood, up 7.9% for the month and 63% y/y; copper and brass mill shapes, 8.5% and 44%, respectively; steel mill products, 18% and 40%; plastic construction products, 3.2% and 10%; aluminum mill shapes, 2.1% and 7.4%; gypsum products, 1.4% and 6.2%; architectural coatings, 1.9% and 5.3%; and insulation materials, 0.7% and 5.2%. In addition, numerous producers have quoted extended or uncertain delivery times and have imposed allocations (quotas) on quantities for customers. Readers are invited to email information about construction costs and supply-chain issues to ken.simonson@agc.org and to register for a webinar on "Soaring Material and Supply-Chain Costs and Delays: What to Expect, How to Cope," on Wednesday, April 14, 3:30-4:30 pm EDT, with Chief Economist Ken Simonson; ConsensusDocs Executive Director Brian Perlberg; and Dan Schnippert, Procurement Director, Marek. March PPIs and other recent information will be included in an update of the Construction Inflation Alert that AGC posted on March 26.
On Wednesday, the Institute for Supply Management issued the March “Services ISM Report On Business,” a monthly survey of purchasing executives. Items relevant to construction that were reported in short supply include construction contractors (for the sixth month in a row) and labor (3 months in a row), personal protective equipment (PPE) (14 months), PVC products (2 months), and steel products (4 months). Items relevant to construction that were reported up in price include construction materials, services, and labor; copper products (2 months); freight (4 months), oriented strand board (4 months) and lumber (3 months); paint-related products; PPE (14 months, but also reported down in price for 2 months), PVC products (7 months); steel (7 months), steel products (2 months), and steel conduit. All 18 sectors covered reported paying higher prices for materials and services. Construction was one of 17 reporting an increase in business activity and in new orders, employment (10 sectors), slower supplier deliveries (14 sectors), and backlog of orders (11 sectors).
Construction employment, not seasonally adjusted, decreased between February 2020 and February 2021 in 236 (66%) of the 358 metro areas (including divisions of larger metros) for which BLS posts construction employment data, increased in 83 (23%) and was unchanged in 39, according to an analysis AGC released on Wednesday. (BLS reports combined totals for mining, logging and construction in most metro areas, to avoid disclosing data about industries with few employers; AGC assumes the construction-only changes in these areas match the combined change.) The largest y/y losses occurred again in Houston-The Woodlands-Sugar Land (-37,600 construction jobs, -16%) and New York City (-26,700 combined jobs, -17%), followed by the Chicago-Naperville-Arlington Heights division (-12,900 construction jobs, -11%) and Midland, Texas (-11,600 combined jobs, -31%). Odessa, Texas had the steepest percentage decline (-40%, -8,200 combined jobs), followed by Lake Charles, La. (-39%, -7,700 construction jobs) and Midland. Sacramento--Roseville--Arden-Arcade again had the largest y/y gains (3,100 construction jobs, 4%), followed by the Seattle-Bellevue-Everett division (2,800 construction jobs, 3%); Ogden-Clearfield, Utah (2,800 combined jobs, 14%) and Boise, Idaho (2,700 combined jobs, 10%). Sierra Vista-Douglas, Ariz. again had the highest percentage increase (40%, 1,000 combined jobs), followed by Cleveland, Tenn. (16%, 300 combined jobs). Nine areas set new lows for February and 30 set new highs, in series dating in most cases to 1990.
There were 266,000 job openings in construction, seasonally adjusted, at the end of February, down 11% from January and down 12% y/y from February 2020, BLS reported on Tuesday in its latest Job Openings and Labor Turnover Survey (JOLTS) release. Hires in February totaled 396,000, up 14% for the month and up 1.5% y/y. JOLTS data combines nonresidential construction with residential; the latter most likely accounts for a disproportionately large share of hires and openings. BLS reported on April 2 that residential construction employment rose 3.0% y/y from March 2020 to March 2021, while nonresidential employment decreased 3.9%.
The Dodge Momentum Index rose 1.7% in March from the revised February reading, Dodge Data & Analytics reported on Wednesday. The index “is a monthly measure of the first (or initial) report for nonresidential building projects in planning, which have been shown to lead construction spending for nonresidential buildings by a full year. [The i]ndex hit its highest level since the summer of 2018 as a result of an increase in institutional projects that entered the planning stage, and which came on the heels of a similar gain for the sector in February. Overall, the Momentum Index for March 2021 was up 11% in total [y/y]. While healthcare and lab projects continue to dominate institutional planning, March saw a more broad-based selection of project types including education and recreation buildings. Institutional building construction rose 14.0% from February, while year-over-year comparisons showed a 10% increase for the sector. Commercial construction, however, dipped 3.9% for the month due to a slight pullback in warehouse activity that other commercial projects could not make up for, though the sector showed a 12% increase” y/y.
The Data DIGest is a weekly summary of economic news; items most relevant to construction are in italics. All rights reserved. Sign up at www.agc.org/datadigest.
