
Spending accelerates in September but fewer metros and states add jobs than in August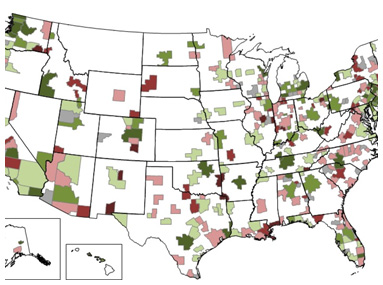 Editor’s note: Construction Citizen is proud to partner with AGC America to bring you AGC Chief Economist Ken Simonson's Data DIGest. Check back each week to get Ken's expert analysis of what's happening in our industry.
Construction spending in September reached a seven-year high of $1.094 trillion at a seasonally adjusted annual rate, 0.6% higher than the August rate and 14% higher than a year before, the Census Bureau reported today. The year-over-year growth rate was the fastest since January 2006. Year-over-year growth was widespread, but monthly declines for private nonresidential construction may signal contractors' difficulty finding enough workers with the right skills or new caution on the part of investors and owners. Private nonresidential spending slid 0.7% for the month but increased 15% over 12 months; private residential climbed 1.9% and 17%, respectively; and public construction, 0.7% and 9.4%. Among private nonresidential segments, in descending order of September size, manufacturing construction fell 0.5% for the month but leaped 41% year-over-year; power, -1.4% and 0.4% (comprising a 29% yearly jump in oil and gas pipelines and field structures offsetting a 12% drop in electric power facilities); commercial (retail, warehouse and farm), -1.2% and -3.1%; and office, -0.4% and 21%. New multifamily construction jumped 4.9% and 27%; new single-family, 1.3% and 13%; and residential improvements, 1.5% and 22%. Of the two largest public segments, highway and street construction gained 0.3% and 9.9%, respectively, while educational added 2.4% and 10.5%.
Construction employment, not seasonally adjusted, increased from September 2014 to September 2015 in only 159 (44%) of the 358 metro areas (including divisions of larger metros) for which the BLS provides construction employment data, decreased in 144 (40%) and was stagnant in 55, according to an AGC release and map last Wednesday that analyzed Bureau of Labor Statistics (BLS) data. (BLS combines mining and logging with construction in most metros, as well as six states and the District of Columbia, to avoid disclosing data about industries with few employers.) It appears likely that employment gains in some metros were held down by a lack of available workers rather than lack of projects. However, other metros probably reflected the effects of the plunge in oil and gas exploration and services business. The largest job losses again were in two metros that previously were among the leaders in construction job gains: the Fort Worth-Arlington, Texas division (-6,200 combined jobs, -8%) and Houston-The Woodlands-Sugar Land (-3,300 construction jobs, -2%), followed by Bergen-Hudson-Passaic, N.J. (-2,700 combined jobs, -9%); New Orleans-Metairie, La. (-1,700 construction jobs, -5%) and Akron, Ohio (-1,600 combined jobs, -12%). The largest percentage declines were in Las Cruces, N.M. (-17%, -600 combined jobs), Lawrence-Methuen Town-Salem, Mass.-N.H. (-17%, -400 combined jobs) and Sierra Vista-Douglas, Ariz. (-17%, 200 jobs). Phoenix-Mesa-Scottsdale, Ariz. added the most jobs (8,200 construction jobs, 9%), followed by Denver-Aurora-Lakewood (7,900 combined jobs, 8%), the Seattle-Bellevue-Everett division (6,900 construction jobs, 8%); and the Los Angeles-Long Beach-Glendale division (6,800 construction jobs, 6%). The largest percentage gains occurred in Weirton-Steubenville, W.Va.-Ohio (33%, 600 combined jobs); Fairbanks, Alaska (19%, 600 construction jobs); Wenatchee, Wash. (17%, 400 combined jobs) and Boise City, Idaho (16%, 2,800 combined jobs).
Seasonally adjusted construction employment rose in 35 states and D.C. from September 2014 to September 2015, declined in 14 states and held steady in Oregon, an AGC analysis of BLS data released on October 20 showed. The number of places with year-over-year gains was the smallest since April 2013. California again gained the most construction jobs (43,900 jobs, 6.5%), followed by Florida (26,700, 6.6%), Washington (11,400, 7.1%) and Pennsylvania (11,300, 4.9%). Arkansas again had the steepest percentage gain (16%, 7,400 jobs), followed by Alaska (11%, 1,900), Kansas (9.5%, 5,600) and South Carolina (9.0%, 7,400). The steepest percentage losses again occurred in West Virginia (-17%, -5,800) and Rhode Island (-11%, -1,800), followed by Ohio (-6.3%, -12,400) and Mississippi (5.1%, -2,400). Ohio and West Virginia again had the largest losses, followed by Minnesota (-2,700, -2.5%) and Mississippi. For the month, there were gains in 23 states, losses in 23 and no change in 4 states and D.C.
Total compensation – wages, salaries, benefits and required employer payments for social insurance and workers compensation – increased 1.9% for all private industry workers from the third quarter (Q3) of 2014 to 2015Q3, BLS reported last Friday. Wages and salaries rose 2.1% over four quarters, while total benefits rose 1.4%. Compensation in construction increased 0.8 for the quarter and 2.1% over four quarters. It is likely that the relatively mild increase in construction reflects a compositional shift, as employment rose more in the lower-paid residential building and specialty trade segments (4.2% from September 2014 to September 2015, according to an AGC analysis of BLS data) than in the higher-paid nonresidential building, specialty trades, and heavy and civil engineering segments (2.8%). Wages and salaries in construction increased 2.4% from 2014Q3 to 2015Q3.
Real (net of inflation) gross domestic product (GDP) increased 1.5% at a seasonally adjusted annual rate in 2015Q3, down from a 3.9% rate in Q2, the Bureau of Economic Analysis reported last Thursday. Real private fixed investment in nonresidential structures slumped 4.0% in Q3 after rising 6.2% in Q2, dragged down by decreases in mining exploration, shafts and wells (-47%) and commercial and health care structures (-3.2%). There were gains in real investment in manufacturing structures (31%); power and communication structures (1.2%); and other structures (13%) but all were smaller than in Q2. Real private fixed residential investment slowed to a 6.1% rate from 9.3% in Q2. Single-family investment rose 9.0%, while multifamily soared 23%. Real government gross investment in structures increased at a 6.2% rate, down from 30% in Q2. The GDP price index increased at 1.2% rate. The index for private nonresidential structures increased at a 1.4% rate; private residential investment, 3.4%; and government structures, 1.6%.
The Data DIGest is a weekly summary of economic news; items most relevant to construction are in italics. All rights reserved. Sign up at www.agc.org/datadigest.
Image courtesy AGC America
