Construction has mixed impact on first-quarter GDP; AIA, NABE surveys point to upturnEditor’s note: Construction Citizen is proud to partner with AGC America to bring you AGC Chief Economist Ken Simonson's Data DIGest. Check back each week to get Ken's expert analysis of what's happening in our industry. Real (net of inflation) gross domestic product (GDP) increased 2.5% at a seasonally adjusted annual rate in the first quarter of 2013, after growing 0.4% in the prior quarter, the Bureau of Economic Analysis (BEA) reported on Wednesday. Real private investment in nonresidential structures (including wells and mines) slipped 0.3%, after jumping 17% in the fourth quarter. Real residential investment climbed 13%, following a 18% gain. Real government investment in structures shrank for the 10th consecutive quarter, at a 5.6% rate, following a 2.6% decline. The price index for private nonresidential structures posted a 1.5% increase at a seasonally adjusted annual rate, similar to the previous quarter’s 1.4% rise. The price index for residential investment accelerated to 5.2% from 3.0% as strong demand from single- and multifamily builders pushed up prices for homebuilding materials. The price index for government investment rose at a 2.3% rate, up from 1.7%.
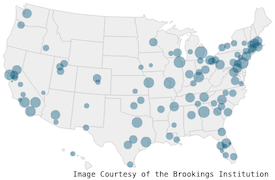
More than half of states add construction jobs in March; Reed, MHC differ on startsEditor’s note: Construction Citizen is proud to partner with AGC America to bring you AGC Chief Economist Ken Simonson's Data DIGest. Check back each week to get Ken's expert analysis of what's happening in our industry.Click here to view March state employment numbers.In March, seasonally adjusted nonfarm payroll employment increased from a year earlier in 49 states and the District of Columbia and dipped by 0.1% (5,800 jobs) in Pennsylvania, the Bureau of Labor Statistics (BLS) reported Friday. Seasonally adjusted construction employment climbed in 31 states and the District of Columbia and fell in 19 states. Alaska had the largest percentage increase (11.4%, 1,900 jobs), followed by Hawaii (10.7%, 3,100 jobs), Utah (8.7%, 6,000 jobs) and Louisiana (8.6%, 10,700 jobs), AGC reported. California added the most new construction jobs over the past 12 months (41,000, 7.1%), followed by Texas (39,800, 6.9%). Rhode Island lost the highest percentage (-9.6%, -1,600 jobs), followed by Montana (-8.1%, -1,900 jobs).

April 22, 2013

Materials costs diverge as bid prices stay flat for building contractors, drop for highwaysEditor’s note: Construction Citizen is proud to partner with AGC America to bring you AGC Chief Economist Ken Simonson's Data DIGest. Check back each week to get Ken's expert analysis of what's happening in our industry.Click here to view the March PPI tables and metro employment figures by state and rank.The producer price index (PPI) for finished goods rose 0.2%, not seasonally adjusted (and fell 0.6%, seasonally adjusted), in March and 1.1% over 12 months, the Bureau of Labor Statistics (BLS) reported today. The PPI for inputs to construction—a weighted average of the cost of all materials used in construction plus items consumed by contractors such as diesel fuel—was unchanged for the month and up 0.9% year-over-year. Indexes for most new nonresidential building construction and subcontractors’ work were similarly flat. The PPIs for new offices, industrial buildings and warehouses were flat in March and rose just 1.0%, 1.1% and 2.3%, respectively, over 12 months.
April 15, 2013

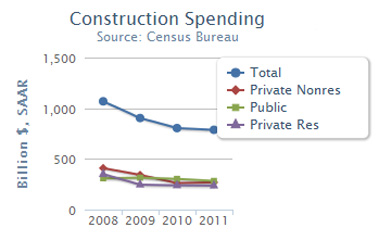
Construction jobs, spending continue gains; outlook varies for factories, offices, apts.Editor’s note: Construction Citizen is proud to partner with AGC America to bring you AGC Chief Economist Ken Simonson's Data DIGest. Check back each week to get Ken's expert analysis of what's happening in our industry.Nonfarm payroll employment increased by 88,000, seasonally adjusted, in March and 1,910,000 (1.4%) over 12 months, the Bureau of Labor Statistics reported today. The unemployment rate was 7.6%, not seasonally adjusted (and seasonally adjusted), down from 8.4% a year earlier. Construction employment rose for the tenth straight month and totaled 5,802,000, seasonally adjusted, the most since September 2009. Construction employment rose 162,000 (2.9%) from March 2012, while total hours worked in construction increased by 3.9%, implying that contractors are lengthening working hours and also hiring new workers. The unemployment rate for former construction workers dropped from 17.2%, not seasonally adjusted, in March 2012 to 14.7%. Residential construction employment (residential building and specialty trade contractors) rose by 14,800, seasonally adjusted, for the month and 77,800 (3.8%) for the year. Nonresidential employment (building, specialty trades, and heavy and civil engineering construction) climbed by 3,000 and 84,400 (2.3%), respectively.Construction spending in February totaled $885 billion at a seasonally adjusted annual rate,
April 05, 2013

Employment picks up in most states but federal cuts loom; rail, factory construction riseEditor’s note: Construction Citizen is proud to partner with AGC America to bring you AGC Chief Economist Ken Simonson's Data DIGest. Check back each week to get Ken's expert analysis of what's happening in our industry. Click here to view February state employment tables.In February, seasonally adjusted nonfarm payroll employment increased from a year earlier in 49 states and the District of Columbia and dipped by 0.3% (800 jobs) in Wyoming, the Bureau of Labor Statistics (BLS) reported today. Seasonally adjusted construction employment climbed in 29 states and D.C., fell in 20 and was unchanged in Delaware. Alaska had the largest percentage increase (13.3%, 2,200 jobs), followed by Hawaii (8.0%, 2,300 jobs) and Texas (7.5%, 43,300 jobs). Texas added the most new construction jobs over the past 12 months, followed by California (35,800, 6.2%). Rhode Island lost the highest percentage (-10.4%, -1,700 jobs), followed by Arkansas (-9.6%, -4,700 jobs). Ohio lost the most jobs (-7,900, -4.3%), followed by Illinois (-7,500, -3.8%). From January to February, seasonally adjusted construction employment rose in 35 states, was static in three, and fell in 12 states and D.C. (BLS combines mining and logging with construction in D.C., Hawaii, Delaware and four other states to avoid disclosing data about industries with few employers).
April 01, 2013

States, metros split between construction job gains, losses; starts jump from a year agoEditor’s note: Construction Citizen is proud to partner with AGC America to bring you AGC Chief Economist Ken Simonson's Data DIGest. Check back each week to get Ken's expert analysis of what's happening in our industry.Click here to view January state and metro data.New state and local construction employment data show an even split between growth and decline from January 2012 to January 2013, according to analyses of Bureau of Labor Statistics (BLS) reports that AGC released this week. BLS reported today that 306 metropolitan areas had year-over-year increases in nonfarm payroll employment, 57 had decreases and nine had no change. AGC reported that of the 339 metro areas (including divisions of larger metros) for which BLS reports construction employment, 145 had increases, 141 had decreases and 53 were stagnant. (BLS combines mining and logging with construction in six states, the District of Columbia and most metros to avoid disclosing data about industries with few employees.
March 25, 2013

PPI jumps in February; contractors are optimistic on hiring and activity, two surveys sayEditor’s note: Construction Citizen is proud to partner with AGC America to bring you AGC Chief Economist Ken Simonson's Data DIGest. Check back each week to get Ken's expert analysis of what's happening in our industry.Click here to view February PPI table.The producer price index (PPI) for finished goods rose 0.8%, not seasonally adjusted (0.7%, seasonally adjusted), in February and 1.7% over 12 months, the Bureau of Labor Statistics reported on Thursday. The PPI for inputs to construction—a weighted average of the cost of all materials used in construction plus items consumed by contractors such as diesel fuel—increased 1.3% for the month and 2.0% year-over-year, outpacing the PPIs for most new nonresidential building construction and subcontractors’ work. The PPI for new offices was flat in February and rose just 1.0% over 12 months; new industrial buildings, 0% and 1.3%, respectively; schools, 0.3% and 1.2%; and warehouses, -0.3% and 2.6%. The new PPI for health care buildings, which dates only to June 2012, was unchanged in February. The PPI for new, repair and maintenance work on nonresidential buildings by electrical contractors fell 0.3 % in February and 0.4% over 12 months; the index for plumbing contractors fell 0.1% for the month but increased 1.6% from a year ago; the index for roofing contractors rose 0.1% and 2.2%, respectively; and concrete contractors, 0.5% and 1.2%
March 15, 2013

Employment shows biggest gain in six years; Beige Book reports widespread pickupEditor’s note: Construction Citizen is proud to partner with AGC America to bring you AGC Chief Economist Ken Simonson's Data DIGest. Check back each week to get Ken's expert analysis of what's happening in our industry.Nonfarm payroll employment increased by 236,000, seasonally adjusted, in February and 1,966,000 (1.5%) over 12 months, the Bureau of Labor Statistics reported on Friday. The unemployment rate was 8.1%, not seasonally adjusted (7.7%, seasonally adjusted), down from 8.7% a year earlier. Construction employment rose for the ninth straight month and totaled 5,784,000, seasonally adjusted, the most since September 2009. The increase of 48,000 from January was the largest one-month gain since March 2007. Construction employment rose 140,000 (2.5%) from February 2012, while total hours worked in construction increased by 3.3%, implying that contractors are lengthening working hours and also hiring new workers. The unemployment rate for former construction workers dropped from 17.1%, not seasonally adjusted, in February 2012 to 15.7%. Residential construction employment (residential building and specialty trade contractors) rose by 19,400, seasonally adjusted, for the month and 64,200 (3.1%) for the year. Nonresidential employment (building, specialty trades, and heavy and civil engineering construction) climbed 29,000 in February and 75,700 (2.1%) over 12 months.
March 11, 2013

Construction spending fell in January, Census says, but Reed reports jump in startsEditor’s note: Construction Citizen is proud to partner with AGC America to bring you AGC Chief Economist Ken Simonson's Data DIGest. Check back each week to get Ken's expert analysis of what's happening in our industry. Construction spending in January totaled $883 billion at a seasonally adjusted annual rate, down 2.1% from December but up 7.1% from January 2012, the Census Bureau reported last week. The November and December totals were each revised up by over $15 billion, reflecting a surge in power construction as contractors rushed to finish wind energy projects to qualify for tax credits by yearend. Private residential construction spending was flat for the month and up 22% from January 2012. Private nonresidential spending slumped 5.1% from December but rose 4.0% year-over-year. Public construction spending fell 1.0% for the month and 3.0% year-over-year. New single-family construction rose 3.6% and 30%, respectively. New multifamily spending rose 1.7% and 55%. Of the top three private nonresidential categories, spending on power construction (including oil and gas fields and pipelines) fell 14% and 2.7%; manufacturing construction fell 2.9% for the month but rose 13% year-over-year; and commercial construction (retail, warehouse and farm) edged up 0.6% and 3.0%.
March 04, 2013
