
Construction posts gains in March jobs, February spending; costs accelerate, RLB says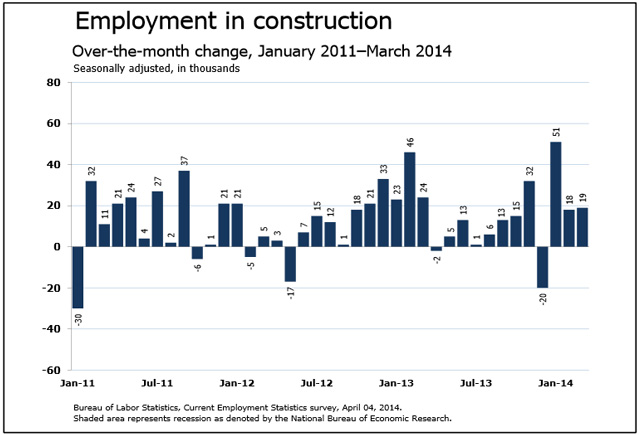 Editor’s note: Construction Citizen is proud to partner with AGC America to bring you AGC Chief Economist Ken Simonson's Data DIGest. Check back each week to get Ken's expert analysis of what's happening in our industry.
Nonfarm payroll employment increased by 192,000, seasonally adjusted, in March and 2,246,000 (1.7%) over 12 months, the Bureau of Labor Statistics (BLS) reported Friday. Construction employment rose by 19,000 for the month and 151,000 (2.6%) over the year to 5,964,000, the highest total since June 2009. Residential construction employment (residential building and specialty trade contractors) climbed by 9,100 for the month and 103,000 (4.8%) for the year. Nonresidential employment (building, specialty trades, and heavy and civil engineering construction) rose by 9,900 from February and 48,800 (1.3%) year-over-year. All five residential and nonresidential segments added workers for the month and year. The unemployment rate for jobseekers who last worked in construction fell to the lowest March level in seven years: 11.3%, down from 14.7% in March 2013 and a high of 24.9% in March 2010. (Industry unemployment data are not seasonally adjusted and should only be compared year-over-year, not across months.) Since March 2010 the number of unemployed construction workers has dropped by 1,301,000, not seasonally adjusted. But construction employment rose by only 445,000, implying that more than 800,000 experienced workers in the past four years left the industry for employment elsewhere, further training or schooling, retirement, or left the workforce. These departures may make it hard for contractors to find skilled workers if demand rises further, even though the unemployment rate remains higher than the overall nonfarm rate (6.8%, not seasonally adjusted; 6.7%, seasonally adjusted).
Construction spending in February totaled $946 billion at a seasonally adjusted annual rate, up 0.1% from January and up 8.7% from February 2013, the Census Bureau reported last Monday. The data may not accurately reflect slowdowns caused by severe winter weather, as Census relies in part on models that project spending for work started in earlier months, in addition to progress reports from a sample of contractors. Private residential spending dropped 0.8% for the month but rose 14% over 12 months. Private nonresidential spending climbed 1.2% from January and 12% from February 2013. Public construction spending inched up 0.1% for the month but fell 1.0% over the year. Of the three residential components, new single-family construction slumped 1.1% for the month but jumped 14% year-over-year; new multifamily leaped 2.6% and 30%, respectively; and improvements to existing residential structures, -1.3% and 9.7%. The largest private nonresidential segment—power (including conventional and renewable power plus oil and gas fields and pipelines)—rebounded 4.4% after plunging 10% in January. Power construction rose 7.9% from a year earlier. The next three private segments (in descending order of 2013 size) were down for the month but up sharply year-over-year: manufacturing construction, -0.5% and 17%; commercial (new and renovated retail, warehouse and farm), -0.6% and 11%; and office, -0.2% and 19%. Of the top two public segments, highway and street construction rose 1.4% and 11%, while public educational spending fell 1.2% and 8.7%.
Construction consultancy Rider Levett Bucknall (RLB) reported on Thursday that its National Construction Cost Index rose at a 3.9% annual rate in the fourth quarter of 2013, up from a 3.2% rate in the third quarter and 3.6% for the full year. The index “tracks the ‘true’ bid cost of construction, which includes, in addition to costs of labor and materials, general contractor and subcontractor overhead costs and fees (profit). The index also includes applicable sales/use taxes that ‘standard’ construction contracts attract.” Among the 12 metro areas for which RLB calculates the index, increases ranged from 0.9% in Las Vegas to 7.7% in Honolulu.
The average increase in union wage and benefit rates in 2013 (including settlements negotiated earlier) was 2.6%, virtually the same rate of increase as in the three previous years, a recent analysis by the Construction Labor Research Council reported. It estimated 2014 and 2015 increases at 2.7% and 2.6%, based on settlements signed through 2013.
“Owners of shopping centers and malls raised rents [by 0.4% and 0.5%, respectively, in first quarter] for the 12th consecutive quarter, a sign that retail landlords are getting a boost from the slowly improving economy and low level of commercial real-estate construction,” the Wall Street Journal reported on Thursday, citing data from Reis Inc. “Some mid-size retailers, like Ross Stores Inc. and TJX Cos., owner of T.J. Maxx and Marshalls stores, have been expanding. But as the onslaught from Internet shopping intensified, major forces in the industry, including Sears and J.C. Penney, closed locations. Others, such as Wal-Mart Stores Inc., Target Corp. and Gap Inc., introduced smaller-size stores. Landlords have been able to raise rents largely because of the dearth of new construction in recent years. Developers completed just 626,000 square feet of strip shopping centers in the first quarter of 2014, roughly one-fourth the level of construction from the previous quarter, and the lowest level since the beginning of 2011, according to Reis. Construction was especially low in the first quarter because of bad weather. ‘Construction activity is suddenly back at the nadir we hit in the wake of the recession,’ said Ryan Severino, an economist with Reis.”
The Data DIGest is a weekly summary of economic news; items most relevant to construction are in italics. All rights reserved. Sign up at www.agc.org/datadigest.

Add new comment