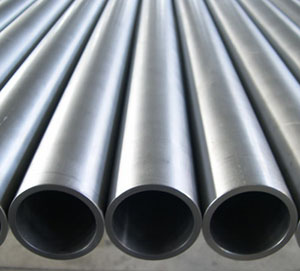
PPIs for construction inputs fall in February but steel vendors post imminent price hikes
Editor’s note: Construction Citizen is proud to partner with AGC America to bring you AGC Chief Economist Ken Simonson's Data DIGest. Check back each week to get Ken's expert analysis of what's happening in our industry.

The producer price index (PPI) for final demand in February, not seasonally adjusted, was unchanged from January and year-over-year (y/y) from February 2015, the Bureau of Labor Statistics (BLS) reported on Tuesday. AGC posted tables and an explanation focusing on construction prices and costs. Final demand includes goods, services and five types of nonresidential buildings that BLS says make up 34% of total construction. The PPI for final demand construction, not seasonally adjusted, decreased 0.1% for the month and increased 1.0% y/y. The PPI for new nonresidential building construction—a measure of the price that contractors say they would charge to build a fixed set of five categories of buildings—rose 1.0% y/y. Changes ranged from -0.1% y/y for healthcare construction to 1.0% for industrial buildings, 1.1% for offices, and 1.4% for warehouses and schools. PPIs for new, repair and maintenance work on nonresidential buildings fell 2.1% y/y for plumbing contractors and rose 1.2% for roofing contractors, 3.5% for concrete contractors and 5.4% for electrical contractors. The index for inputs to construction—excluding capital investment, labor and imports—comprises a mix of 59% goods (including 5% for energy) and 41% services (including trade services, 26%; transportation and warehousing, 4%; and other services, 10%). The overall PPI for inputs to construction slid 0.1% for the month and 1.7% y/y. The PPI for all goods used in construction fell 0.6% and 3.7%, respectively, as the sub-index for energy sank 5.5% and 28%, while goods less food and energy dipped 0.2% for the month and 0.7% y/y. The index for services rose 0.5% and 1.1%, respectively. PPIs for inputs to seven categories of new nonresidential structures all declined for the month and year, with y/y decreases ranging from 1.6% for industrial structures to 3.4% for power and communications structures. PPIs for inputs to new single- and multifamily construction posted y/y declines of 0.8% and 1.2%, respectively. Materials important to construction that had notable one- or 12-month price changes include diesel, down 4.6% for the month and 40% y/y; steel mill products, -1.0% and -18%, respectively; copper and brass mill shapes, 1.3% and -14%; aluminum mill shapes, 0.6% and -11%; lumber and plywood, -0.2% and -6.4%; and flat glass, 0 and 6.6%.
Some vendors have recently announced steel price increases. On March 14, Gerdau Long Steel North America wrote to customers that it "will be increasing the transactional price of Reinforcing Bar Products" on March 21 by $30 per ton. On Wednesday, Nucor Buildings Group wrote, "we will be implementing a modest price increase of 2% - 3% effective for all building orders quoted on or after April 25" and Commercial Metals Company wrote it "will be increasing the transactional price for reinforcing steel products by $20/ton" on April 1. Readers are invited to submit letters to simonsonk@agc.org.
Seasonally adjusted construction employment rose in 44 states and the District of Columbia from January 2015 to January 2016 and declined in six states, an AGC analysis of Bureau of Labor Statistics (BLS) data released on March 14 showed. California again added the most jobs (45,700 jobs, 6.5%), followed by Florida (38,500, 7.3%) and Texas (18,700, 2.8%). Hawaii again posted the steepest percentage gain (16%, 5,100 jobs), followed by Rhode Island (12.7%, 2,100), Nevada (10.2%, 6,800) and Massachusetts (9.9%, 13,200). The six states that shed construction jobs during the past 12 months have been hurt by the steep drop in oil and gas drilling and coal mining. North Dakota lost the highest percentage and total number (-14.4%, -5,300 jobs), followed by Alaska (-8.7%, -1,600), West Virginia (-7.4%, -2,500), Wyoming (-5.1%, -1,200), Kansas (-2.2%, -1,300) and Pennsylvania (-1.5%, -3,600). From December to January, seasonally adjusted construction employment increased in 30 states and D.C., decreased in 18 states and held steady in Delaware and New Hampshire. (The data include annual state and metro "benchmark" revisions dating back to 2011. AGC's rankings are based on seasonally adjusted data, which is available only for construction, mining and logging combined in D.C., Delaware, Hawaii, Maryland, Nebraska, South Dakota and Tennessee. For the latter four, BLS now posts not-seasonally-adjusted employment for construction separately.)
Construction employment, not seasonally adjusted, increased from January 2015 to January 2016 in 243 (68%) of the 358 metro areas (including divisions of larger metros) for which BLS provides construction employment data, decreased in 72 (20%) and was stagnant in 43, according to an AGC release and map on Thursday that analyzed BLS data. (BLS combines mining and logging with construction in most metros.) The Anaheim-Santa Ana-Irvine, Calif. division again added the most jobs during the past year (12,400 construction jobs, 15%), followed by Houston-The Woodlands-Sugar Land (11,000 construction jobs, 6%); Orange-Rockland-Westchester, N.Y. (7,700 combined jobs, 22%); and Atlanta-Sandy Springs-Roswell, Ga. (7,600 construction jobs, 7%). The largest percentage gains occurred in El Centro, Calif. (61%, 1,100 combined jobs), Weirton-Steubenville, W.Va.-Ohio (33%, 500 combined jobs); and Monroe, Mich. (30%, 600 combined jobs). Job losses were concentrated in oil- or coal-producing areas: Fort Worth-Arlington (-4,700 jobs, -6%), Odessa, Texas (-3,800 jobs, -19%); Midland, Texas (-3,500 jobs, -12%) and Greeley, Colo. (-3,100 jobs, -16%). The largest percentage declines for the past year were in Odessa; Greeley; Victoria, Texas (-14%, -900 jobs) and Huntington-Ashland, W.V.-Ky.-Ohio (-14%, -1,100 jobs).
The value of nonresidential construction starts, not seasonally adjusted, increased 3.7% for January and February combined compared with the same months of 2015, CMD reported on March 11, based on data it collected. The value of nonresidential building starts rose 2.3% year-to-date and heavy engineering starts climbed 5.9%.
The Data DIGest is a weekly summary of economic news; items most relevant to construction are in italics. All rights reserved. Sign up at www.agc.org/datadigest.


