How Does Payroll Fraud Impact Reporting of Employment in Construction? [1]
 [2]
[2] An industry insider who has been closely following our coverage of the payroll fraud issue [10] raised a fascinating point recently. This executive I was chatting with put forward a theory: If construction volume is picking up, you'd think employment would go up as well. But, if so much of the workforce is misclassfied, then those workers would be in "payables," not "payroll." Or put more simply: One big reason the construction employment rate does not keep up with the volume of construction is precisely because of employee misclassification [9].
Hmm...
I picked up the phone and called Ken Simonson [11], the Chief Economist at AGC America [12] and new Construction Citizen blogger [11]. Here's what he told me:
"Employment tends to be “stickier” than output. That is, firms scale back workers’ hours, at least for the most valuable workers, rather than lay them off when activity drops. Conversely, when work picks up, firms initially move workers from the shop, office or training room to the field, put part-timers to work full-time, and pay for overtime before they commit to hiring new workers. In addition, there is anecdotal information that contractors have been achieving significant productivity improvements through adoption of building information modeling (BIM), laser- and GPS-guided equipment, and other hardware, software and management innovations. These factors enable firms to produce more with the same workforce. Finally, output should be measured in “real” (inflation-adjusted) dollars to compare to the number of workers (or hours worked). The Census Bureau figures on construction put in place are not adjusted for changes in bid prices.
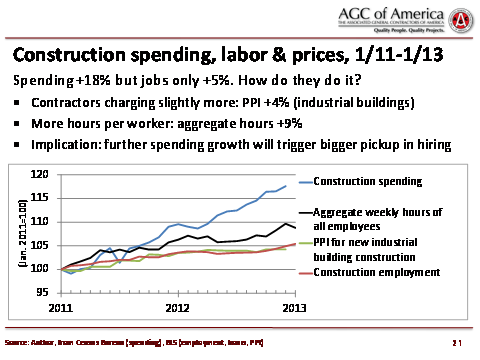
The graph I'm sending you (shown above) compares value put in place (construction spending) with employment, hours and prices. All series are set at 100 in January 2011, the low point for construction employment and one month before the low for spending. From then through December 2012, spending rose 18% but employment climbed 5%. (Employment, hours and prices are available through January 2013. Spending data is available through December; preliminary January estimates will be released on Friday, March 1.) Hours of all employees in construction rose 9%, meaning that existing employees worked longer hours in addition to new employees being hired. The bid price for new buildings rose 5% (in this case, industrial buildings, but similar patterns exist for office, warehouse and school construction), suggesting that real spending increased about 13%, and the actual gap between spending and workers is 13%-9%=4%, not 18%-5%=13%. I think it’s quite possible that productivity has risen 4% in two years. But it is also possible that spending has shifted toward less labor-intensive types of projects; that one or more of the data series has been mismeasured (spending is particularly subject to revisions); and that firms are using (or treating more workers as) independent contractors more."
Your thoughts are welcome in the comments.