AGC Data DIGest: Feb. 27- March 3, 2023 [1]
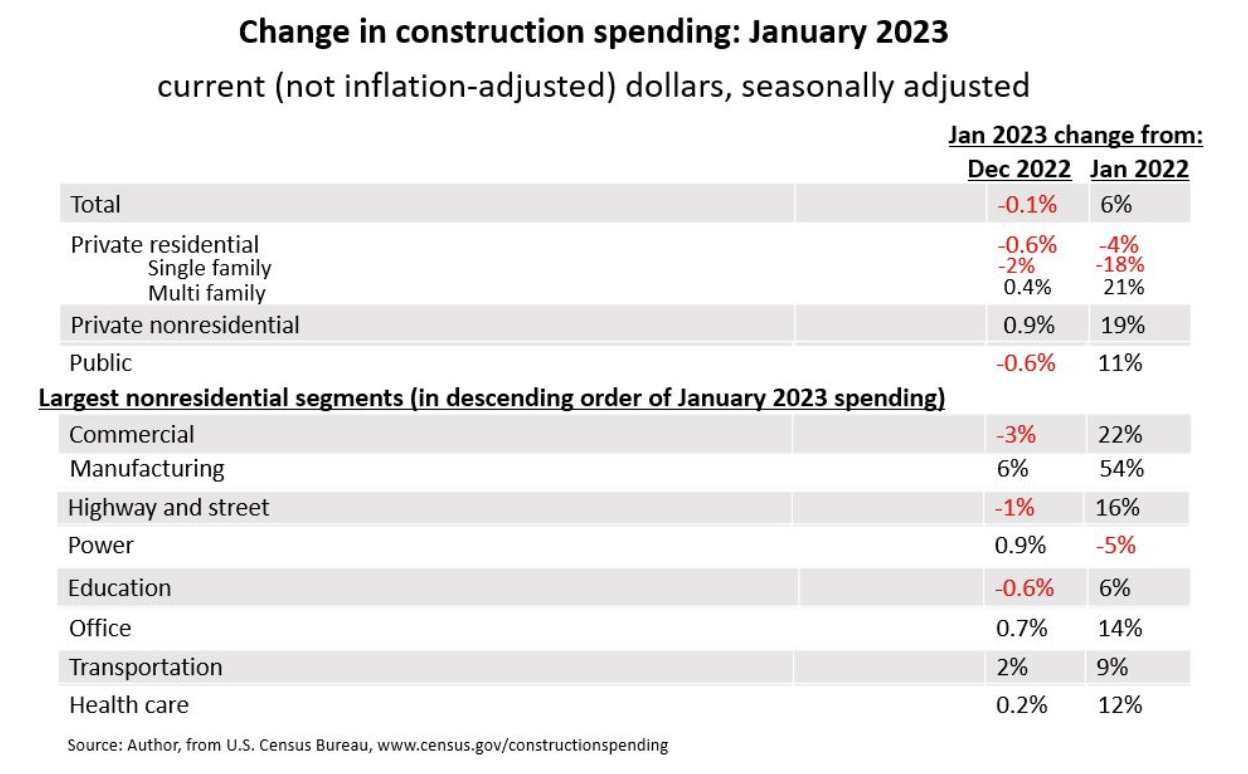
 Construction spending (not adjusted for inflation) totaled $1.83 trillion in January at a seasonally adjusted annual rate, down 0.1% from the upwardly revised December rate and up 5.7% year-over-year (y/y), the Census Bureau reporte [8]d [8] o [8]n Wednesday. However, without a deflator, it is impossible to say how much of the y/y gain is in units vs. price. Private residential construction decreased for the eighth-straight month, by 0.4%, with single-family homebuilding down 1.7%, multifamily construction spending up 0.4%, and owner-occupied improvements up 0.3%. Private nonresidential construction spending rose 0.9%. The largest private nonresidential segment (based on the seasonally adjusted January rate)—manufacturing construction soared 6.0% (including computer/electronic/electrical, up 8.8%, and chemical and pharmaceutical, up 4.5%). Commercial construction fell 3.1% (consisting of warehouse, down 0.9%; retail, down 2.5%; and farm, down 18%). Power rose 1.0% (with electric power up 1.0% and oil and gas field structures and pipelines up 0.3%). Private office and data center construction increased 0.5%. Public construction spending fell 0.6%. The largest public segment, highway and street construction, declined 0.9%. Public education slipped 0.6%. Public transportation construction increased 2.0%.
There have been mixed trends for input prices recently. Makers of hot-rolled coil, the basic ingredient for many construction steel products, have raised prices 56% in the past three months, from $640 per ton at the end of November to $1000/ton last week. But New South Construction Supply reported [9] on Tuesday, “Rebar and mesh are two…items that have seen recent softening. Adequate mill stock and lower industry demand has generated a surplus of supply in the market. Lead times for both items are currently about a week after a purchase order is placed.” The national average retail price of on-highway diesel fuel dropped by 33 cents per gallon (7.1%) from January 30 to February 27, the Energy Information administration reported on Monday. The February 27 average, $4.29, is 19 cents higher than a year earlier, just before Russia’s invasion of Ukraine drove prices to record levels. Readers are invited to supply information about input costs and supply to ken.simonson@agc.org [10].
The outlook for multifamily construction appears to be cooling. The National Association of Home Builders reported [11] on February 23 that its Multifamily Production Index increased two points to 34 compared to the previous quarter. Readings below 50 indicate that more developers see declining than expanding demand. The index “is a weighted average of three key elements of the multifamily housing market: construction of low-rent units-apartments that are supported by low-income tax credits or other government subsidy programs; market-rate rental units-apartments that are built to be rented at the price the market will hold; and for-sale units—condominiums. The component measuring low-rent units increased 5 points to 41, the component measuring market rate apartments dropped 1 point to 38 and the component measuring for-sale units remained even at 23.” All three components declined from a year ago. Similarly, the American Institute of Architects reported [12] on February 22 that the residential (multifamily) subindex of its Architecture Billings Index slipped in January to 45.9 from 46.2 in December and 52.3 in January 2022. Any score below 50 means more participating architecture firms reported decreased billings than increased billings. “Apartment rents fell in every major metropolitan area in the U.S. over the past six months through January, a trend that is poised to continue as the biggest delivery of new apartments in nearly four decades is slated for this year,” the Wall Street Journal reported on Tuesday. “Renters with new leases in January paid a median rent that was 3.5% lower than they would have paid last August, according to estimates from listing website Apartment List. It was the first time in five years that rent fell every month over a six-month period, according to the same estimates. Four other market measures by housing-data companies also show that new-lease rents either fell or remained flat in January compared with the previous month, extending a streak of monthly rent declines that began at the end of the summer.”
Data DIGest is a weekly summary of economic news. Sign up here [13]. Editor: Ken.Simonson@agc.org [14], Chief Economist, AGC. Go here for Ken’s PPT [15] or more construction data [16].

