
Construction jobs, spending shrink in latest month but rise for year; metros vary widely
 Editor’s note: Construction Citizen is proud to partner with AGC America to bring you AGC Chief Economist Ken Simonson's Data DIGest. Check back each week to get Ken's expert analysis of what's happening in our industry.
View construction employment figures by state and rank.
Nonfarm payroll employment increased by 165,000, seasonally adjusted, in April and 2,077,000 (1.6%) over 12 months, the Bureau of Labor Statistics reported today. The March gain, initially reported as a weak 88,000, was revised up to 138,000. The unemployment rate was 7.1%, not seasonally adjusted (7.5%, seasonally adjusted), down from 7.7% a year earlier. Construction employment dipped by 6,000 for the month, following 10 consecutive monthly increases, and totaled 5,790,000, seasonally adjusted, a gain of 154,000 (2.7%) over the past year. Total hours worked in construction increased by 3.0% over 12 months, implying that contractors are lengthening working hours and also hiring new workers. The unemployment rate for jobseekers who last worked in construction dropped to 13.2% from 14.5% in April 2012 and an April high of 21.8% in 2010. Residential construction employment (residential building and specialty trade contractors) rose by 13,300, seasonally adjusted, for the month and 83,700 (4.1%) for the year. Nonresidential employment (building, specialty trades, and heavy and civil engineering construction) fell by 19,700 in April but rose by 70,100 (2.0%) over 12 months. Architectural and engineering services employment, a harbinger of future demand for construction, rose 1.8% over the year.
Construction spending in March totaled $857 billion at a seasonally adjusted annual rate, down 1.7% from the downwardly revised February total but up 4.8% from March 2012, the Census Bureau reported on Wednesday. Private residential spending increased 0.4% for the month and 18% year-over-year. Private nonresidential spending dropped 1.5% for the month and rose 2.8% from a year earlier. Public construction spending decreased 4.5% and 5.5%, respectively. Of the three residential components, new single-family construction rose 1.6% and 38%, respectively; improvements to existing single- and multifamily buildings fell 1.4% and 9.9%; and new multifamily spending gained 0.3% and 53%. The three largest private nonresidential components (in descending order of current size) decreased for the month but rose year-over-year: power construction (including conventional and renewable power plus oil and gas fields and pipelines), -2.3% and +1.9%, respectively; manufacturing construction, -1.1% and +4.0%; and commercial (new and renovated retail, warehouse and farm), -3.1% and +1.0%. The top two public categories decreased for the month and year-over-year: highway and street construction. -5.2% and 5.0%, respectively; and educational, -2.9% and -7.7%.
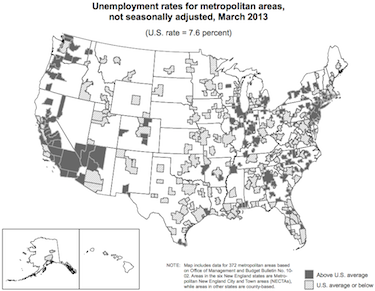
BLS reported on Wednesday that 287 out of 372 metropolitan areas had year-over-year increases in nonfarm payroll employment, 80 had decreases and five had no change from March 2012 to March 2013. An AGC analysis showed that of the 339 metro areas (including divisions of larger metros) for which BLS reports construction employment, 152 had increases, 126 had decreases and 61 were stagnant. (BLS combines mining and logging with construction in most metros to avoid disclosing data about industries with few employees. Metro data is not seasonally adjusted.) Pascagoula, Miss. again added the highest percentage of new construction jobs (47%, 1,700 combined jobs) followed by Fargo, N.D. (21%, 1,300 combined jobs) and Merced, Calif. (19%, 300 combined jobs). The Dallas-Plano-Irving division added the most jobs (12,000 combined jobs, 11%), followed by Houston-Sugar Land-Baytown (8,500 construction jobs, 5%). The largest job losses were in the Chicago-Joliet-Naperville division (-2,700 construction jobs, -3%) and Northern Virginia (-2,700 combined jobs, -4%), followed by Cincinnati-Middletown, Ohio-Ky.-Ind. (-2,600 combined jobs, -7%). Monroe, Mich. (-19%, -500 combined jobs) lost the highest percentage, followed by Rockford, Ill. (-18%, -700 combined jobs).
Compensation costs for private industry, a measure of wages and salaries, benefits and required employer payments such as unemployment and workers’ compensation, increased 0.3%, seasonally adjusted, in the first quarter of 2013 and 1.8% over 12 months, BLS reported on Tuesday. Compensation costs for construction rose 0.7% in the quarter and 2.0% year-over-year, the fastest yearly gain since December 2008. BLS does not break out residential and nonresidential construction in this data set. Because the generally lower-paying residential sectors grew faster than nonresidential over the past year, it is likely the compensation in both actually went up more than 2.0%. Wages and salaries in construction rose 0.3% in each of the last two quarters and 1.7% from March 2012 to March 2013.
The Census Bureau on Tuesday released County Business Patterns: 2011, “which provides the only detailed annual information on the number of establishments, employees, and quarterly and annual payroll for nearly 1,200 industries covered at the national, state and county levels. The statistics are broken down according to employment-size classes (for example, number of establishments with one to four employees) and legal form of organization (for example, corporations and partnerships)….Construction showed the largest decline in establishments, losing 24,946 establishments (3.7%) in 2011, down to 657,738 overall.” An establishment is a fixed business location, not a job site; most construction firms have just one.
Upcoming Simonson Presentations:
5/9 - Free Webinar with Reed Construction, AIA
5/14 Austin, Texas - AGC Austin Chapter Breakfast
5/15 San Antonio, Texas - San Antonio AGC Breakfast
5/15-16 Houston, Texas - NABE Conference
5/17 Houston, Texas - Houston Economics Club
5/22 New York, N.Y. - The Basic Industries Group Lunch
6/4 Tuscon, Ariz. - Arizona Builders' Alliance Lunch
Note: The next Data DIGest will be sent on May 14.
The Data DIGest is a weekly summary of economic news; items most relevant to construction are in italics. All rights reserved. Sign up at www.agc.org/datadigest.

Add new comment