
 Construction employment, seasonally adjusted, totaled 7,498,000 in October, an increase of 44,000 from the upwardly revised September total and a gain of 169,000 (2.3%) year-over-year (y/y) from October 2020, according to AGC’s analysis of Bureau of Labor Statistics (BLS) data posted on Friday. Nevertheless, the October total was 150,000 (-2.6%) below the pre-pandemic peak in February 2020. Residential construction employment, comprising residential building and specialty trade contractors, increased by 10,900 in October, putting the total 89,000 (3.0%) higher than in February 2020. Nonresidential construction employment—building, specialty trades, and heavy and civil engineering construction—rose by 33,000, following an increase of 25,800 in September, the first back-to-back gains since January. But nonresidential employment remains 239,000 (-5.1%) below the February 2020 level. Nonresidential employment has regained only 63% of the jobs it lost between February and April 2020, compared to 81% for total nonfarm payroll employment and 119% for residential construction. A total of 398,000 former construction workers were unemployed in October, matching the October 2019 total and down 41% from October 2020. The industry’s unemployment rate in October was 4.0%, not seasonally adjusted, compared to 6.8% in October 2020 and tying with October 2019 for the second-lowest October rate in the 22-year history of the series. (The only lower October rate was in 2018, 3.6%.) This historically low number of jobseekers helps explain why contractors report so much difficulty filling positions. (Individuals are counted as unemployed only if they have “actively looked for work in the prior four weeks.”)
The difference between average hourly earnings in construction and in the total nonfarm private sector continued to shrink in October, according to AGC’s analysis of BLS data posted on Friday. Hourly earnings for all employees in construction averaged $33.38, seasonally adjusted, an increase of 4.7% y/y and a “premium” of 7.8% over the average for the nonfarm private sector ($30.96, up 4.9% y/y). The construction premium was 10.0% as recently as February 2020. For “production and nonsupervisory workers” the premium shrank from 20.9% in February 2020 to 17.8% last month. The premium has declined as historically low-wage employers such as restaurants and warehouses raise starting pay. The smaller premium and lack of flexibility in hours, location, and working conditions for construction jobs, especially craft (“production”) jobs may be adding to contractors’ difficulty filling positions.
The Covid-19 vaccination rate among construction workers in the four weeks through October 24-30 was 52.5%, compared to 80.7% for other occupations, according to the construction safety and health research organization CPWR. Conversely, construction workers have a far higher “vaccine hesitancy” rate, 43.9% vs. 17.3% for other occupations. The figures, based on an ongoing survey of Facebook users by the Delphi Group of Carnegie Mellon University, suggest another reason contractors are short of healthy workers.
Contractors’ bid prices soared in October, though the y/y increase in construction input costs exceeded the rise in bid prices, according to BLS data posted on Tuesday. The producer price index (PPI) for new nonresidential building construction—a measure of the price that contractors say they would bid to build a fixed set of buildings—jumped 7.1% from September and 12.6% y/y, while the PPI for material and service inputs to new nonresidential construction climbed 1.3% for the month and 21.1% y/y. There were double- or even triple-digit percentage increases y/y in PPIs for numerous inputs: steel mill products, 4.8% for the month and 142% y/y; diesel fuel, 12% and 100%, respectively; aluminum mill shapes, 1.4% and 37%; copper and brass mill shapes, 0 and 37%; plastic construction products, 2.5% and 30%; gypsum products, 1.8% and 25%; insulation materials, -1.3% and 17%; truck transportation of freight, 2.5% and 16%; asphalt felt and coatings, 0.2% and 16%; and architectural coatings, 0.7% and 12%. There were smaller but nevertheless unusually large y/y increases for flat glass, up 2.6% for the month and 9.8% y/y; construction machinery and equipment, 1.6% and 7.0%, respectively; asphalt paving mixtures and blocks, 0.7% and 6.8%; concrete products, 0 and 6.5%; and brick and structural clay tile, 2.4% and 6.0%. Bid prices, as measured by PPIs for new buildings and subcontractors, leaped 13% for the month and 21% y/y for new warehouse building construction; 8.5% and 14%, respectively for industrial buildings; and roughly 6% for the month and 12% y/y for office, school, and health care buildings. PPI increases for new, repair, and maintenance work amounted to 11% for the month and 19% y/y for concrete contractors; 4.7% and 8.6%, respectively, for electrical; 2.6% and 8.6% for roofing; and 3.5% and 7.4% for plumbing contractors. AGC posted tables and graphs of construction PPIs.
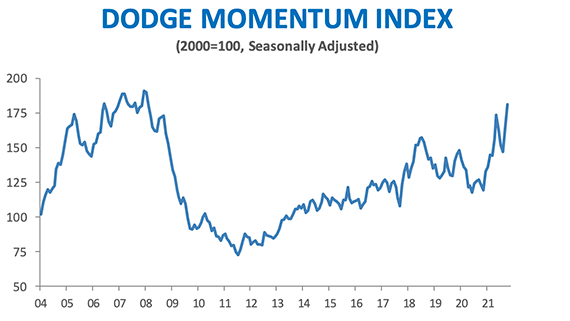
The Dodge Momentum Index increased 10% in October from September, Dodge Construction Network reported on Friday. The index “is a monthly measure of the initial report for nonresidential building projects in planning, which have been shown to lead construction spending for nonresidential buildings by a full year. In October, commercial planning rose 14% and institutional gained 3%. The value of nonresidential building projects entering planning has staged a solid recovery this fall. It has lifted the Momentum Index to its highest level in nearly 14 years, following a near-moribund summer of activity. The commercial sector has shown strength, having reached its highest level since the inception of the Index. The October gain in the Momentum Index was driven by increased planning in warehouses, offices, and healthcare structures. Compared to a year earlier, the Momentum Index was 47% higher in October 2021. The commercial planning component was 59% higher, and institutional was 26% higher.”
