
 Seasonally adjusted construction employment in November lagged the February 2020 level in 32 states and exceeded it in 18 states and the District of Columbia, according to AGC’s analysis of Bureau of Labor Statistics (BLS) data posted this month. (February 2020 was the month in which employment peaked nationally before plunging during widespread shutdowns in March and April 2020.) Texas lost the most construction jobs over 21 months (-42,600 jobs or -5.5%), followed by New York (-39,700, -9.7%) and California (-23,100, -2.5%). Louisiana had the largest percentage loss (-14%, -19,800 jobs), followed by Wyoming (-13%, -3,000) and New York. Florida added the most jobs (8,700, 1.5%), followed by Utah (8,200, 7.2%) and Washington (6,200, 2.8%). South Dakota added the highest percentage (10%, 2,500 jobs), followed by Idaho (8.7%, 4,800) and Utah. For the month, construction employment increased in 36 states and D.C., declined in 13 states, and was flat in Kansas. Florida added the most jobs (8,200, 1.4%), followed by Illinois (3,800, 1.7%) and Texas (3,600, 0.5%). Montana had the largest percentage gain (800 jobs, 2.7%), followed by Missouri (2.6%, 3,200), Wisconsin (2.1%, 2,600) and Vermont (2.1%, 300). Louisiana lost the most construction jobs for the month (-2.200 jobs, -1.8%), followed by North Carolina (-1,900, -0.8%) and New Jersey (-1,800, -1.2%). Louisiana also had the largest one-month percentage loss (-2,200, -1.8%), followed by Oklahoma (-1.5%, -1,200), New Jersey and North Carolina. (BLS reports combined totals for mining, logging, and construction in D.C., Delaware, and Hawaii. Because there are few, if any, mining or logging jobs in these locations, AGC treats the levels and changes as solely construction employment.)
Total construction starts fell 14% from October to November at a seasonally adjusted annual rate, data firm Dodge Construction Network reported on Thursday. “Nonbuilding and nonresidential building starts bore the brunt of the decline, falling 30% and 21% respectively after seeing sharp increases in October as three large projects broke ground. Residential starts gained a modest 3%. Without October’s large projects, total construction starts in November would have increased by 5%.” Over the first 11 months of 2021 combined, starts increased 13% compared to January-November 2020. Nonresidential building starts climbed 11% year-to-date. Commercial starts increased 7% year-to-date; manufacturing starts, 86%; and institutional starts, 5%. Nonbuilding starts rose 1% year-to-date: environmental public works, 19%; utility/gas plant starts, 15%; highway and bridge starts, -7%; and miscellaneous nonbuilding, -15%. Residential starts rose 20% year-to-date, with single-family starts up 20% and multifamily starts up 23%.
Housing starts (units) jumped 12% at a seasonally adjusted annual rate from October to November and 8.3% year-over-year from the November 2020 level, the Census Bureau reported on Thursday. Year-to-date starts for January-November 2021 rose 16% from the same months in 2020. Single-family starts climbed 11% for the month and 15% year-to-date. Multifamily (five or more units) starts increased 12% and 20%, respectively. Residential permits increased 3.6% from October and 19% year-to-date, as single-family permits increased 2.7% and 16%, respectively, while multifamily permits increased 6.1% and 28%. The number of authorized multifamily units that have not started—an indicator of potential near-term starts—soared 55% year-over-year.
“In the third quarter [Q3] of 2021 apartments and other multifamily residential construction showed a continuation of the suburban shift that was characteristic of prior quarters, per the most recent data from NAHB’s Home Building Geography Index,” the National Association of Home Builders reported on Thursday. From Q3 2020 to Q3 2021, “the share of new multifamily permits fell from 40.5% to 37.9% in large metro core markets. Meanwhile, the permit share in small metro area counties increased from 24.9% to 27.2%. Though these percentage changes seem relatively small, they are statistically significant changes. Historically, year-to-year changes in multifamily market share are usually slow to develop and rarely move more than one percentage point higher or lower. This makes these latest year-over-year numbers noteworthy. The market shares [of] small towns and rural areas, which make up less than 10% of all activity…, as with the other lower density submarkets,…have been rising since 2016.”
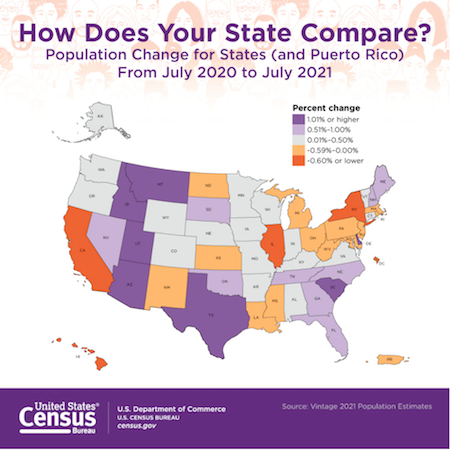
U.S. population growth slowed between July 1, 2020 and July 1, 2021 to “0.1%, the lowest rate since the nation’s founding,” the Census Bureau reported Tuesday. Population changes over time are a major contributor to demand for numerous types of construction, funding for public construction, and supply of potential construction workers. “The slow rate of growth can be attributed to decreased net international migration, decreased fertility, and increased mortality due in part to the COVID-19 pandemic,” but also to rising numbers of very old people and more deaths of younger adults from suicide and drug overdoses. Population increased in 33 states and decreased in D.C. and 17 states, “a historically large number of states to lose population.” Idaho grew the fastest of any state, 2.9%, as it added 53,151 residents, 90% from other states. Population grew by 1.7% in Utah (46,291) and Montana (18,078) and 1.4% in Arizona (98,330). Texas had the largest numerical increase (310,288 or 1.1%, 7th in percentage growth), followed by Florida (211,196; 1.0%, 8th), Arizona, and North Carolina (93,985; 0.9%, 11th). D.C. had the steepest percentage loss (-2.9%, -20,043), followed by New York (-1.6%, -319,020), Illinois (-0.9%, -113,776), Hawaii (-0.7%, -10,358), and California (-0.7%, -261,902). New York had the largest numerical decrease, followed by California and Illinois. State gains and losses were driven primarily by state-to-state migration, as all states had net international immigration. The largest net domestic migration gains were in Florida (220,890), Texas (170,307) and Arizona (93,026). The largest migration to other states occurred in California (-367,299), New York (-352,185), and Illinois (-122,460).
