Construction spending, number of metros with job gains rise in October
 Editor’s note: Construction Citizen is proud to partner with AGC America to bring you AGC Chief Economist Ken Simonson's Data DIGest. Check back each week to get Ken's expert analysis of what's happening in our industry.
View October metro employment figures by state and rank here.
Construction spending in October totaled $909 billion at a seasonally adjusted annual rate, up 0.8% from the September total and up 5.3% from October 2012, the Census Bureau reported on Tuesday. The number was the highest since May 2009, but only because initially higher estimates for August and July were revised down by $11 billion and $7 billion, respectively. The gain since September was attributable to a 3.9% rise in public construction spending, which also climbed 2.3% compared with October 2012. Nevertheless, the year-to-date total for public construction was 2.8% below the total for the first 10 months of 2012 combined. Private residential spending slipped 0.6% for the month, but rose 18% year-over-year and 17% year-to-date. Private nonresidential spending decreased 0.5% from September and 3.4% from October 2012, but was up 0.8% year-to-date. Of the top two public categories, highway and street construction rose 0.6% for the month, 9.2% from a year ago and 0.3% year-to-date. Public educational spending jumped 8.5% from September, but fell 3.7% from October 2012 and 8.5% year-to-date. Of the three residential components, new single-family construction dipped 0.6% for the month but rose 18% year-over-year and 30% year-to-date. New multifamily construction soared 2.2%, 38% and 46% over the three intervals. Spending on improvements to existing single- and multi-family buildings fell 1.2% for the month, rose 13% from a year ago and dipped 0.3% year-to-date. The largest private nonresidential segment—power (including conventional and renewable power plus oil and gas fields and pipelines)—fell 5.7% for the month, 19% from a year ago, and 5.8% year-to-date. But the next three (in descending order of current size) rose in all three periods: manufacturing construction, 1.3%, 3.3% and 3.9%; commercial (new and renovated retail, warehouse and farm), 2.8%, 6.6% and 5.6%; and office, 1.2%, 1.0% and 7.1%.
Construction employment increased in 215 out of 339 metropolitan areas (including divisions of larger metros) in the 12 months through October, declined in 74 and was flat in 50, according to an analysis of Bureau of Labor Statistics (BLS) data that AGC released last Wednesday. (BLS combines mining and logging with construction in most metros to avoid disclosing data about industries with few employers. Because metro data is not seasonally adjusted, comparisons with months other than October are not meaningful.) The Santa Ana-Anaheim-Irvine, Calif. metro division added the most jobs in the past year (8,900 construction jobs, 8%); followed by Atlanta-Sandy Springs-Marietta (8,500 construction jobs, 10%) and the Boston-Cambridge-Quincy division (7,500 construction jobs, 14%). The largest percentage gains occurred in Pascagoula, Miss. (35%, 1,500 combined jobs); Eau Claire, Wis. (28%, 900 combined jobs) and Steubenville-Weirton, Ohio-W.Va. (24%, 400 combined jobs). The largest job losses were in Sacramento-Arden-Arcade-Roseville (-4,300 construction jobs, -11%); Raleigh-Cary, N.C. (-3,500 combined jobs, -12%) and the Gary, Ind. division (-3,300 construction jobs, -15%). The largest percentage declines for the past year were in Modesto, Calif. (-22%, -1,500 combined jobs); Gary; and Rockford, Ill. (-15%, -700 combined jobs). Among the 21 metro areas that hit a new October construction employment peak, Fargo, N.D.-Minn. experienced the largest percentage increase (22% higher than in October 2012). Lake Havasu City-Kingman, Ariz. experienced the largest percentage decline compared to its October peak (-75% since October 2005).
Occupancy and rent levels (or revenue per available room for hotels) generally increased in the third quarter and year-over-year, according to the latest Real Estate Market Cycle Monitor, issued today by Dividend Capital Research. The report covers more than 50 metro areas and five property types: office, industrial, apartment, retail and hotel. Although all markets for offices remain in the “recovery” phase with declining vacancies but rents too low to make construction cost-feasible, “new office space is needed for the hoteling and benching concepts and thus creating demand for new flexible floor plans….Almost half of all [industrial] markets are now in the growth phase of the cycle [characterized by declining vacancy and new construction.] While U.S. [apartment] demand continues to be strong, new supply growth is accelerating. While supply growth has matched demand the last two quarters, the new starts and projected completions are expected to accelerate over the next year and far surpass demand. [Newer retail] space is in strong demand by national retailers...New [hotel] supply growth continues to be reasonable and moderate in most markets.”
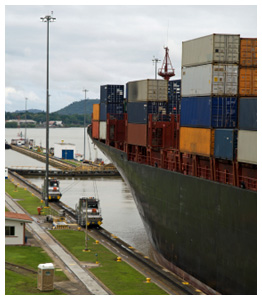
The Maritime Administration on November 25 released the first of four reports assessing possible impacts from the impending Panama Canal expansion on U.S. trade flows, ports and other infrastructure. “To deliver high performance to larger ships, changes are needed across all aspects of terminal operations. Many of these improvements are already being made at certain terminals as they expand capacity to be ready for larger ships in 2015.” Construction will be required to accommodate: more and larger ship-to-shore cranes, expanded container storage, gate-processing capability and operational changes at rail intermodal terminals.
The Data DIGest is a weekly summary of economic news; items most relevant to construction are in italics. All rights reserved. Sign up at www.agc.org/datadigest.
AGC's Data DIGest: Nov. 25 - Dec. 2, 2013
by Ken Simonson | December 02, 2013


Add new comment