
South, West lead in population growth as cities outpace suburbs; starts rise, MHC says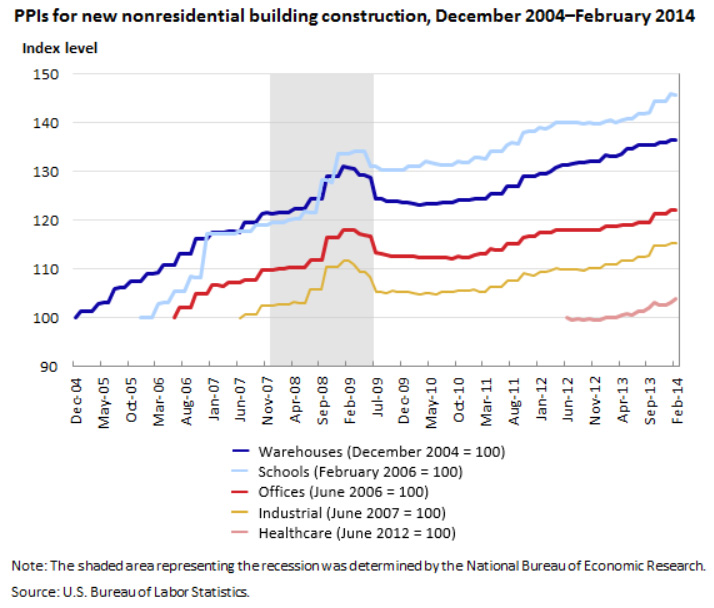 Editor’s note: Construction Citizen is proud to partner with AGC America to bring you AGC Chief Economist Ken Simonson's Data DIGest. Check back each week to get Ken's expert analysis of what's happening in our industry.
“The South and West dominated the list of fastest-growing municipalities between 2012 and 2013, claiming all of the top 15, seven of which were in Texas,” the Census Bureau reported last Thursday. “San Marcos, Cedar Park and Georgetown—each near Austin—ranked among the 10 fastest-growing cities with populations of 50,000 or more during the year ending July 1, 2013. San Marcos was number one in percent growth [8.0%] for the second consecutive year, with Austin itself gaining more people (nearly 21,000) than any [other] city with fewer than 1 million residents.” Population growth is a major driver of residential construction and contributes to demand for many other types, particularly if growth occurs in new areas or outer parts of metro areas. The Wall Street Journal reported last Thursday, “just 18 of America’s 51 metropolitan areas with more than 1 million people had cities growing faster than their suburbs last year, down from 25 in 2012, according to an analysis of census data by William H. Frey, a demographer at the Brookings Institution….Overall, cities are still growing slightly faster than the suburbs—a historical anomaly after decades of American migration to the burbs….Cities in metro areas grew at a 1.02% annual rate in 2012-2013, down from 1.13% in 2011-12, according to Mr. Frey’s analysis. Suburban areas, by contrast, grew at a rate of 0.96%,” virtually unchanged from 0.95% the year before.
New construction starts in April rose 3% at a seasonally adjusted annual rate, McGraw Hill Construction (MHC) reported last Wednesday, based on data it collected. “The increase maintained the upward movement established in March, which followed sluggish activity at the outset of 2014. By major sector, April gains were reported for nonresidential building [14%] and housing [4%], while nonbuilding construction (public works and electric utilities) retreated [-14%]. Through the first four months of 2014, total construction starts on an unadjusted basis [were] unchanged from the same period a year ago,” with nonresidential building starts up 4%, residential starts up 3% and nonbuilding construction starts down 10%. MHC Chief Economist Robert Murray commented, “The commercial and manufacturing categories are regaining momentum, while institutional building is making the transition to an up-and-down pattern after its steady decline over the past five years. Multifamily housing continues to move at a good clip. On the down side, this year’s total construction volume is being restrained by a more subdued pace for public works, given the comparison to last year’s elevated amount and the uncertain prospects for getting new transportation legislation passed. Another cautionary note is related to single-family housing, which through the first four months of 2014 had yet to move beyond the modest erosion that emerged towards the end of last year.”
“Business conditions at U.S. architecture firms showed signs of stabilizing in April, however the month’s ABI [Architecture Billings Index] score of 49.6 still reflected a slight decline in billings from March levels once seasonal adjustments were factored in,” the American Institute of Architects (AIA) reported last Thursday. “Even while this protracted weakness in billings continues, there are signs that growth may be around the corner. The inquiries index reading was 59.1, the strongest showing for growth in inquires so far this year. Even more significantly, the new design contracts index for April was 54.6, the strongest reading for this index since the AIA began tracking this indicator in late 2010.” The ABI “provides an approximately nine- to 12-month glimpse into the future of nonresidential construction spending activity. The diffusion indexes contained in the full report are derived from a monthly ‘Work-on-the-Boards’ survey that is sent to a panel of AIA member–owned firms. Participants are asked whether their billings increased, decreased, or stayed the same in the month that just ended, as compared to the prior month, and the results are then compiled into the ABI. These monthly results are also seasonally adjusted to allow for comparison to prior months. The monthly ABI index scores are centered near 50, with scores above 50 indicating an aggregate increase in billings, and scores below 50 indicating a decline.” In April, ABI sub-indexes for practice specialties, based on three-month averages, diverged: residential, 52.6 (down from 52.7 in March); mixed practice, 50.7 (up from 48.9); commercial/industrial, 50.2 (down slightly from 50.5); and institutional, 47.1 (down from 48.3).
The Bureau of Labor Statistics (BLS) separately analyzed changes in nonresidential building construction materials and supply input costs and contractor markups in an article posted on May 16. “These data are of particular interest because they come directly from active contractors in the field, and the supply and demand of work is a key factor in any contractor’s markup decision….An aggregate, research index of the overhead and profit markup data was created to aid in this analysis.” The markup index rose 10% from December 2004 through August 2007, leveled off in the second half of 2007, then plunged 24% through November 2010. It stayed “within 2.5% of the November 2010 low through May 2013.” These turning points closely match those for the level of nonresidential construction spending put in place, showing that contractors’ overhead and margins expand and fall with the volume of business. The index for materials and supply inputs, in contrast, more closely follows supply and demand in the broader economy, reflecting overall demand for diesel fuel and fabricated metal.
The Data DIGest is a weekly summary of economic news; items most relevant to construction are in italics. All rights reserved. Sign up at www.agc.org/datadigest.

Add new comment