
Manpower finds hiring plans are stable; market appears hot for renewables, data centers
Editor’s note: Construction Citizen is proud to partner with AGC America to bring you AGC Chief Economist Ken Simonson's Data DIGest. Check back each week to get Ken's expert analysis of what's happening in our industry.
"Hiring plans remain relatively stable" for April-June 2016, after adjusting for seasonal variation, compared to January-March, "and employers report no change compared to one year ago at this time," ManpowerGroup reported on Tuesday in releasing its latest quarterly survey of 11,000 U.S. employers. Employers in all 13 industry sectors included in the survey have a positive outlook for the second quarter. "When the industry sector data is compared quarter over quarter,...hiring activity is expected to remain relatively stable nationwide" in construction and 10 of the 12 other sectors. Construction is one of three sectors in the Midwest in which employers anticipate "slightly stronger hiring prospects," one of five sectors in the Northeast in which employers expect hiring to be weaker, and among the sectors expecting stable hiring prospects in the South and West.
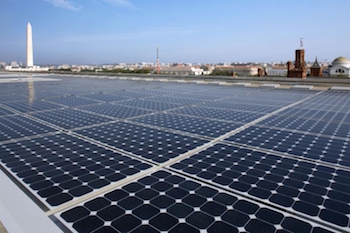
"Electric generating facilities expect to add more than 26 gigawatts (GW) of utility-scale generating capacity to the power grid during 2016," the Energy Information Administration reported on March 2. "Most of these additions come from three resources: solar (9.5 GW), natural gas (8.0 GW) and wind (6.8 GW), which together make up 93% of total additions. If actual additions ultimately reflect these plans, 2016 will be the first year in which utility-scale solar additions exceed additions from any other single energy source....The top five states where solar capacity is being added are California (3.9 GW), North Carolina (1.1 GW), Nevada (0.9 GW), Texas (0.7 GW) and Georgia (0.7 GW)....Four states plan to add more than 1 GW of natural gas-fired capacity this year: Pennsylvania (1.6 GW), Virginia (1.4 GW), Florida (1.3 GW) and Texas (1.1 GW)....Most wind additions are found in the Plains region between the Dakotas and Minnesota, south to Texas and eastern New Mexico." Large companies are installing renewable energy power sources in addition to contracting with generating firms. "With nearly 350 commercial solar installations on its buildings, [Wal-Mart Stores Inc.] outpaces every other corporation in America for on-site solar-adoption, according to the Solar Energy Industries Association," the Wall Street Journal reported on Wednesday. The article notes General Motors is getting electricity generated by wind and by burning landfill gas and trash. "Whole Foods Market Inc...., which already has rooftop solar systems on 25 of its 434 U.S. stores, is planning to install solar panels on 100 more."
Data-center construction appears to be remaining strong, although there are no public data on the size of the market. On March 3, e-newsletter Data Center Knowledge reported that operator Equinix will build a center in Dallas, which the newsletter called "one of the hottest data center markets in the U.S. [and] a key network interconnection hub." On March 2, the newsletter reported that operator "IO is planning to expand data center capacity in its native Phoenix market....Sentinel Data Centers has started construction on the second phase of its Durham, N.C., data center. The project will add 120,000 square feet total, with 50,000 square feet of data center space and 10MW of power....CoreSite Realty Corp. announced that a Fortune 500 company has pre-leased the entire second phase of a big new data center it is building on its Silicon Valley data center campus in Santa Clara," Calif. The newsletter also cited data-center construction in Northern Virginia, Las Vegas and Reno.
Moderate demand growth continued in the fourth quarter of 2015 (4Q15) for income-producing properties, real-estate analysis firm Dividend Capital Research reported on February 29 in its quarterly Cycle Monitor analyzing conditions in more than 50 metro areas. A chart showed nearly all property subtypes were in the expansion phase of the real estate cycle, characterized by new construction along with declining vacancy rates. The exceptions were office—downtown, which was in recovery (no construction despite declining vacancies) and close to expansion, and office—suburban, which was at an earlier stage of recovery (declining rents). Office occupancy rose 0.2% in 4Q15 and was up 0.5% year-over-year (y/y). "Solid employment growth helped tenants absorb more than 17 million square feet in 4Q15 led by the Chicago, San Francisco and Seattle markets. New construction remained lower than absorption for the year and was still 30% less than the pre-recession peak in 2006. Pre-leased space was above 60% in new construction, indicating that tenants are optimistic about their future business prospects." Industrial occupancies increased 0.2% in 4Q15 and 0.6% y/y, "with 70% of the markets covered now having rents that allow for cost-feasible new construction." The national apartment occupancy average declined 0.3% in 4Q15 and was flat y/y "because new construction is higher than demand and continues to accelerate." Retail occupancies were up 0.1% in 4Q15 and 0.5% y/y. Hotel occupancies increased an average of 0.2% in 4Q15 and 1.0% y/y.
On March 2, the Bureau of Economic Analysis released estimates for the third quarter of 2015 for gross domestic product (GDP) by state for 21 industry sectors. Construction increased 7.1% at a seasonally adjusted annual rate from the second quarter of 2015 to the third quarter and contributed to real GDP growth in the District of Columbia and every state except North Dakota and West Virginia. The construction contribution to state GDP growth was greatest in Hawaii and Oklahoma.
The Census Bureau released its quarterly services survey on Thursday. Revenue for architectural and related services firms in the fourth quarter of 2015 increased 1.6% from the third quarter and 0.4% y/y, but full-year revenue fell 0.9% from 2014 to 2015. Revenue for engineering services firms fell 0.3% from the third quarter, 8.2% y/y, and 3.3% for the full year.
On March 3, BLS posted an article comparing nonfarm employment by major industry in 1910 and 2015. Construction employment nearly tripled, from 2.3 million to 6.45 million, but the industry's share of employment fell by half, from 9% to 4%. Manufacturing had the largest share decline, from 32% to 9%. "Other professional services" grew the most: from 3% to 29%.
The Data DIGest is a weekly summary of economic news; items most relevant to construction are in italics. All rights reserved. Sign up at www.agc.org/datadigest.
