
Most states add jobs in November; BLS projects steep gains but no new peak by 2022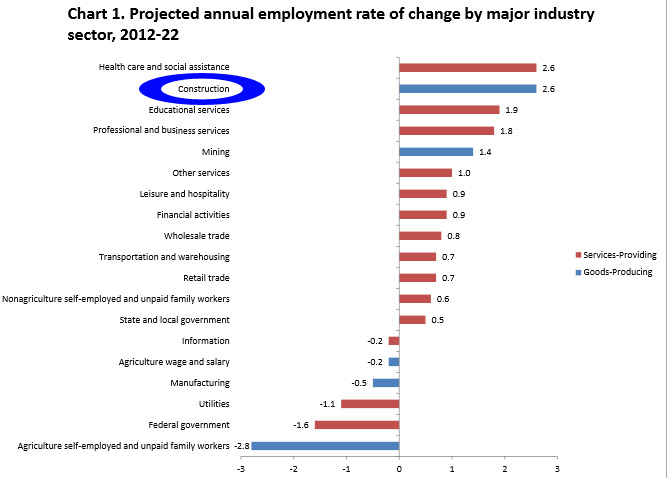 Editor’s note: Construction Citizen is proud to partner with AGC America to bring you AGC Chief Economist Ken Simonson's Data DIGest. Check back each week to get Ken's expert analysis of what's happening in our industry.
In November, seasonally adjusted nonfarm payroll employment increased from a year earlier in 49 states and the District of Columbia and decreased in Alaska, the Bureau of Labor Statistics (BLS) reported Friday. Seasonally adjusted construction employment climbed in 39 states (the same year-over-year total as in October), declined in 10 states and D.C., and held steady in Delaware, an AGC analysis showed. Mississippi again had the steepest year-over-year percentage increase (17%, 8,000 jobs), followed by Connecticut (11%, 5,600 jobs), Missouri (9.8%, 10,100 jobs) and Georgia (9.5%, 13,200 jobs). California added the most construction jobs for the year (31,500, 5.2%), followed by Florida (24,300, 7.0%), Texas (13,300, 2.2%), Georgia and Missouri. Job losses were milder than previously: -4.0% (-900 jobs) in Montana, followed by D.C. (-3.7%, -500) and Indiana (-3.4%, -4,100). Ohio shed the largest number of construction jobs for the year (-5,200, -2.9%), followed by Indiana. For some states, the monthly and year-over-year rankings were very different. For instance, of the 30 states that added construction jobs from October to November, Indiana had the largest percentage gain (4.8%, 5,400 jobs), followed by New Hampshire (3.5%, 800 jobs). Conversely, the steepest losses for the month occurred in Kentucky (-3.1%, -2,100), Louisiana (- 2.6%, -3,700) and Mississippi (-2.3%, -1,300). Thirty states added construction jobs over the month, 16 lost jobs, while employment was stable in four states and D.C. (BLS combines mining and logging with construction in D.C., Delaware and five other states.)
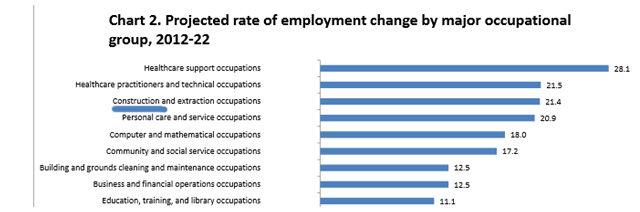
BLS issued its latest 10-year labor force and employment projections on Thursday. Among the findings: “Employment in the construction sector is projected to grow 2.6% annually,” tying health care and social assistance as the fastest growing of 19 sectors and more than double the all-industry rate of 1.0%. “This equates to 1.6 million new jobs over the 2012-22 decade, the most among goods-producing sectors and third most among all major industry sectors….Despite expected fast growth, construction sector employment in 2022 is projected to be below the peak level (7.7 million; 2006)….Of the 30 occupations projected to have the largest percentage increase between 2012 and 2022, 14 are related to healthcare and 5 are related to construction:” mechanical insulation workers (13,500 jobs, 47% growth); helpers—brickmasons, blockmasons, stonemasons, and tile and marble setters (10,500 jobs, 43% growth); segmental pavers (700 jobs, 38% growth); helpers—electricians (22,400 jobs, 37% growth); and brickmasons and blockmasons (25,200 jobs, 35% growth). The largest projected increases in construction occupations are in laborers (260,000, 24%) and carpenters (218,000, 24%). In addition, laborers are projected to need an additional 230,000 workers as replacements, the most of any construction occupation.
The value of construction starts (including residential) plunged 11% from October to November at a seasonally adjusted annual rate, McGraw Hill Construction (MHC) reported on Thursday, based on data it collected. “The downturn followed heightened activity in October, which showed the strongest pace for construction starts so far during 2013. Both nonresidential building and nonbuilding construction pulled back [-17% and -21%, respectively] from their elevated October amounts. At the same time, residential building showed modest growth [+1%] in November, continuing the steady upward trend that’s been present during most of 2013. For the first eleven months of 2013, total construction starts on an unadjusted basis [were] up 6% from the same period a year ago [with residential up 25%, nonresidential building, 8%; and nonbuilding, -15%]. If the volatile electric utility category is excluded from the year-to-date statistics, total construction starts for the first eleven months of 2013 would be up 14%.”
The value of nonresidential construction starts rose 2.0% from November 2012 to November 2013, Reed Construction Data reported on Tuesday, based on data it collected. Year-to-date starts, covering the first 11 months of each year, climbed 4.3%, with commercial starts up 34%, including a 49% gain for retail starts. Industrial (manufacturing) building starts dropped 15% year-to-date. Institutional building starts fell 10.5%, with starts for schools and colleges down 8.0% and hospitals and clinics off 4.2%. Heavy engineering (nonbuilding) starts rose 3.9%; the largest subcategory, road and highway construction starts edged up 1.1%; water and sewage construction, 4.8%; and miscellaneous, -6.3%.
Housing starts in November jumped 23% at a seasonally adjusted annual rate from October and 30% from November 2012, the Census Bureau reported on Wednesday. Multifamily (5 or more units) starts soared 26% and 38%, respectively. Single-family starts leaped 21% and 26%. Building permits dipped 3.1% for the month but rose 7.9% year-over-year; multifamily permits, -11.5% and 4.8%, respectively; and single-family, 2.1% and 10%.
State personal income growth slowed slightly to 1.1% in the third quarter of 2013 from 1.2% in the second quarter, the Bureau of Economic Analysis reported on Thursday. Construction made the largest contribution of any sector to growth in earnings (wages and salaries, supplements and proprietors’ income less contributions for government social insurance).
The next Data DIGest will be published during the week of January 6.
The Data DIGest is a weekly summary of economic news; items most relevant to construction are in italics. All rights reserved. Sign up at www.agc.org/datadigest.

Add new comment