
Construction spending hits 5-1/2 year high; more metros add jobs; Beige Book is sunny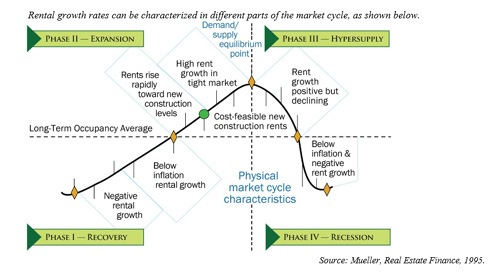 Editor’s note: Construction Citizen is proud to partner with AGC America to bring you AGC Chief Economist Ken Simonson's Data DIGest. Check back each week to get Ken's expert analysis of what's happening in our industry.
Construction spending in July totaled $981 billion at a seasonally adjusted annual rate, up 1.8% from the rate in June, up 8.2% from July 2013, and the highest level since December 2008, the Census Bureau reported last Tuesday. Census revised up the totals for June (by $14 billion) and May ($5 billion). Private residential spending increased 0.7% for the month and 8.0% over the latest 12 months; private nonresidential spending, 2.1% and 14%, respectively; and public construction spending, 3.0% and 2.1%. Of the three residential components, new single-family construction rose 0.5% in July and 9.4% year-over-year; new multifamily, 0.2% and 41%, respectively; and improvements to existing residential structures, 1.2% and -1.7%. The largest private nonresidential segment was power construction (including conventional and renewable power plus oil and gas fields and pipelines), which soared 7.5% for the month and 29% year-over-year. The next largest private segments (in descending order of current size) were manufacturing, 4.4% and 25%; commercial (new and renovated retail, warehouse and farm), -2.5% and 8.6%, respectively; and office, -1.3% and 23%. Of the top two public segments, highway and street construction gained 6.9% for the month and 3.0% over 12 months, while public educational spending rose 1.6% and 0.6%.
From July 2013 to July 2014, construction employment increased in 223 out of 339 metropolitan areas (including divisions of larger metros) for which the Bureau of Labor Statistics (BLS) reports construction data, declined in 72 and was unchanged in 44, according to an analysis that AGC released [4] on August 27. (BLS combines mining and logging with construction in most metros to avoid disclosing data for industries with few firms. Because metro data is not seasonally adjusted, comparisons with months other than July are not meaningful.) The Dallas-Plano-Irving division again added the most construction jobs in the past year (9,400 combined jobs, 8%), followed by Houston-Sugar Land-Baytown (8,900 construction jobs, 5%) and the Philadelphia division (8,500 combined jobs, 12%). The largest percentage gains occurred in Lake Charles, La. (27%, 2,900 construction jobs), Crestview-Fort Walton Beach-Destin, Fla. (26%, 1,000 combined jobs) and Monroe, Mich. (23%, 500 combined jobs). Phoenix-Mesa-Glendale lost the most jobs (-4,800 construction jobs, -5%), followed by the Bethesda-Rockville-Frederick, Md. division (-3,500 combined jobs, -10%).The steepest drop was Steubenville-Weirton, Ohio-W.V. (-22%, -400 combined jobs), followed by Vineland-Millville-Bridgeton, N.J. (-16%, -400 combined jobs).
Informal soundings of businesses in the 12 Federal Reserve districts “indicated that economic activity has expanded [between July 7 and August 22]; however, none of the districts pointed to a distinct shift in the overall pace of growth,” the Fed reported last Wednesday in the latest “Beige Book.” Districts are referenced by the name of their headquarters cities. “Construction was cited as a source of increased demand by manufacturing contacts in the Philadelphia, Chicago, Minneapolis and Kansas City districts. Chicago reported that…higher demand for construction machinery overshadowed weakness for agricultural and mining machinery….New [home] construction and existing home sales generally grew modestly; market conditions tended to vary by metropolitan area and by neighborhood within metropolitan areas. Boston, New York and Dallas reported high levels of ongoing multifamily construction projects; Chicago reported a moderate pace of growth and San Francisco noted a pickup in activity. A little over half of the districts reported some degree of growth in nonresidential real estate activity, with increased construction, leasing, or both tied to steady or falling vacancy rates and to rent increases. None of the districts reported a decline in overall activity, although New York and St. Louis described activity as mixed. In addition to traditional office space, certain districts reported increased demand for specific projects: Boston noted demand for construction in the hospitality sector, Philadelphia cited industrial and warehouse projects, Richmond noted distribution centers and St. Louis reported new retail and mixed-use projects as well as new industrial facility construction….Contacts cited shortages of…construction workers in Atlanta....Atlanta, Chicago, Dallas and San Francisco noted greater wage pressure for jobs in [construction] among others. Some general contractors in the Cleveland district reported that they have increased wages and upgraded benefit plans as a means of attracting and retaining skilled workers….San Francisco cited higher building supply prices.”
Accelerating economic and employment growth “seems to have created moderate but sustainable demand for most real estate,” wrote Glenn Mueller of Dividend Capital Research in the second quarter 2014 Real Estate Market Cycle Monitor on August 28. “It has also kept new supply at low and sustainable levels for the foreseeable future, except in the case of apartments. New apartment supply is too high, mainly due to low interest rate government financing availability….Most office markets had very little movement in occupancies, thus the recovery phase continues….Strong demand [for industrial space] in energy-driven cities like Austin, Dallas and Denver have pushed double-digit rent growth in those industrial markets. While new completions are growing in some major port markets, it has not been high enough to cause concern by investors….Most markets are past their peak [apartment] occupancy levels and are starting a moderate occupancy decline with all the new completions come on line in 2014….The strong 2013 holiday [retail] sales caused many retailers to plan expansion in 2014, which should create positive occupancy increases in 2014 and 2015….Many markets are now seeing new [hotel] construction to meet the increasing demand, but few are in danger of going into the hypersupply phase of the cycle.”
The Data DIGest is a weekly summary of economic news; items most relevant to construction are in italics. All rights reserved. Sign up at www.agc.org/datadigest.

Add new comment